
Data Analysis and Infographics
Here are some infographics and visualizations:
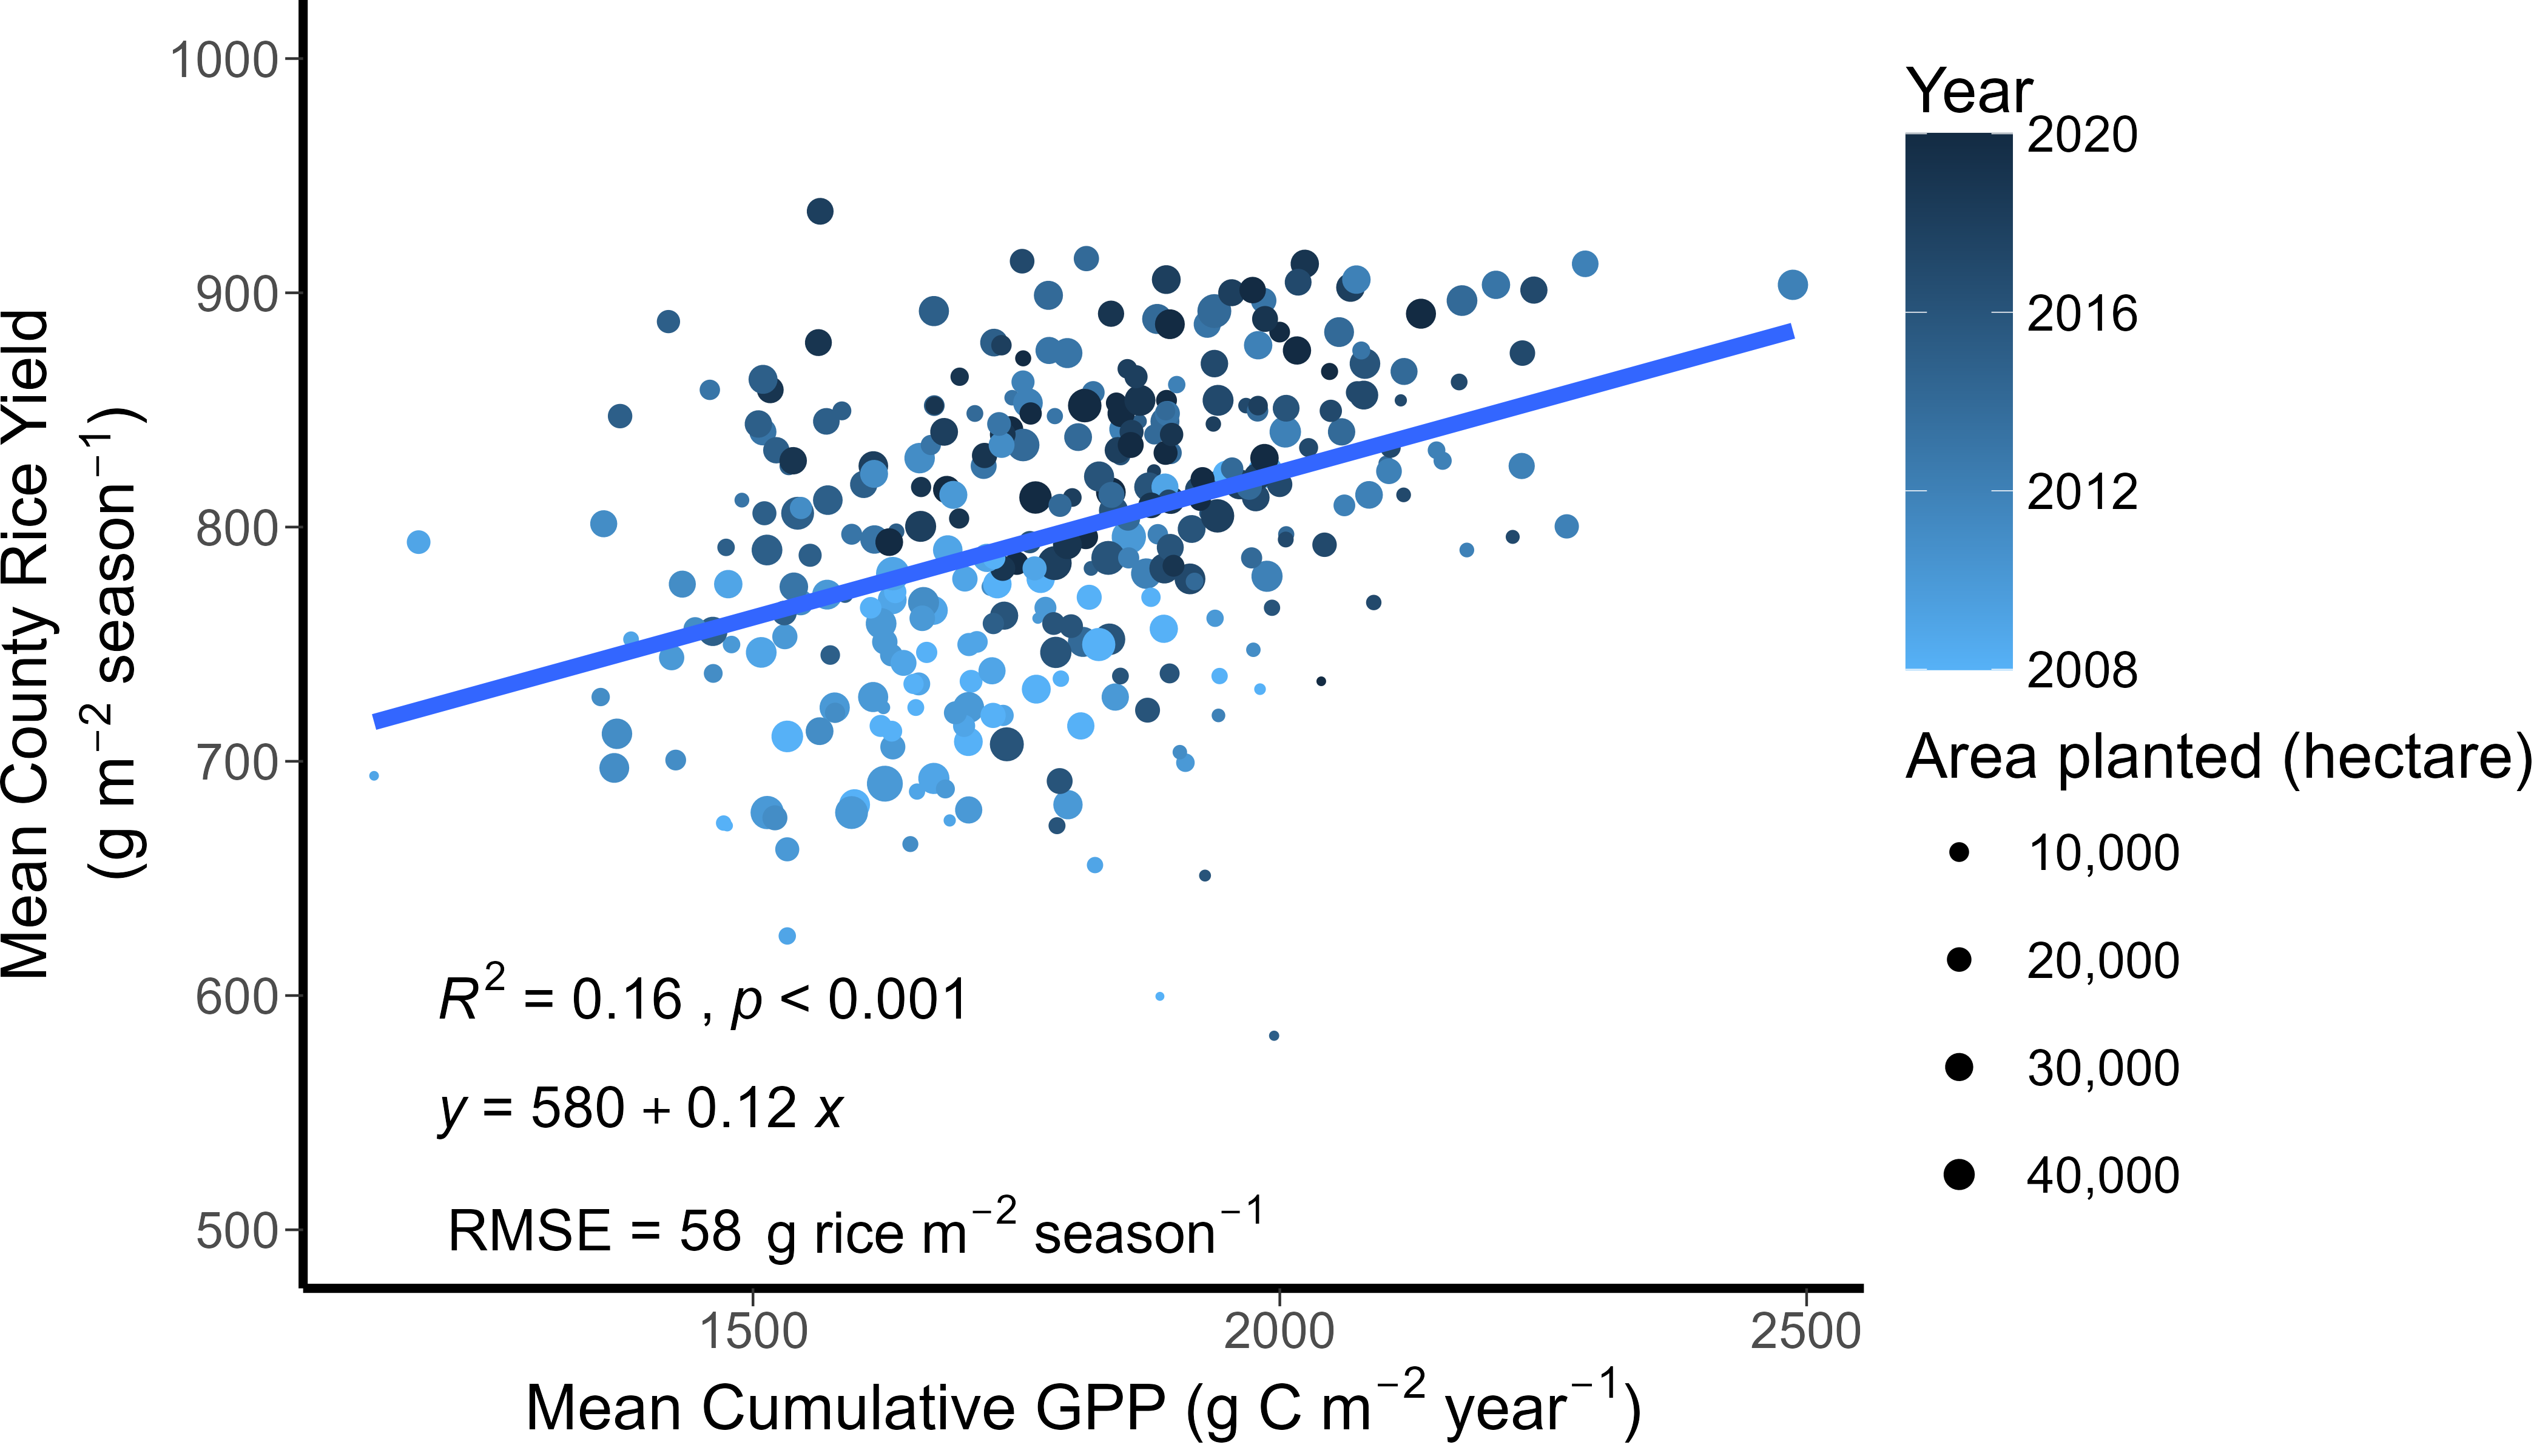
Relationship between Yield and Gross Primary Productivity (GPP)
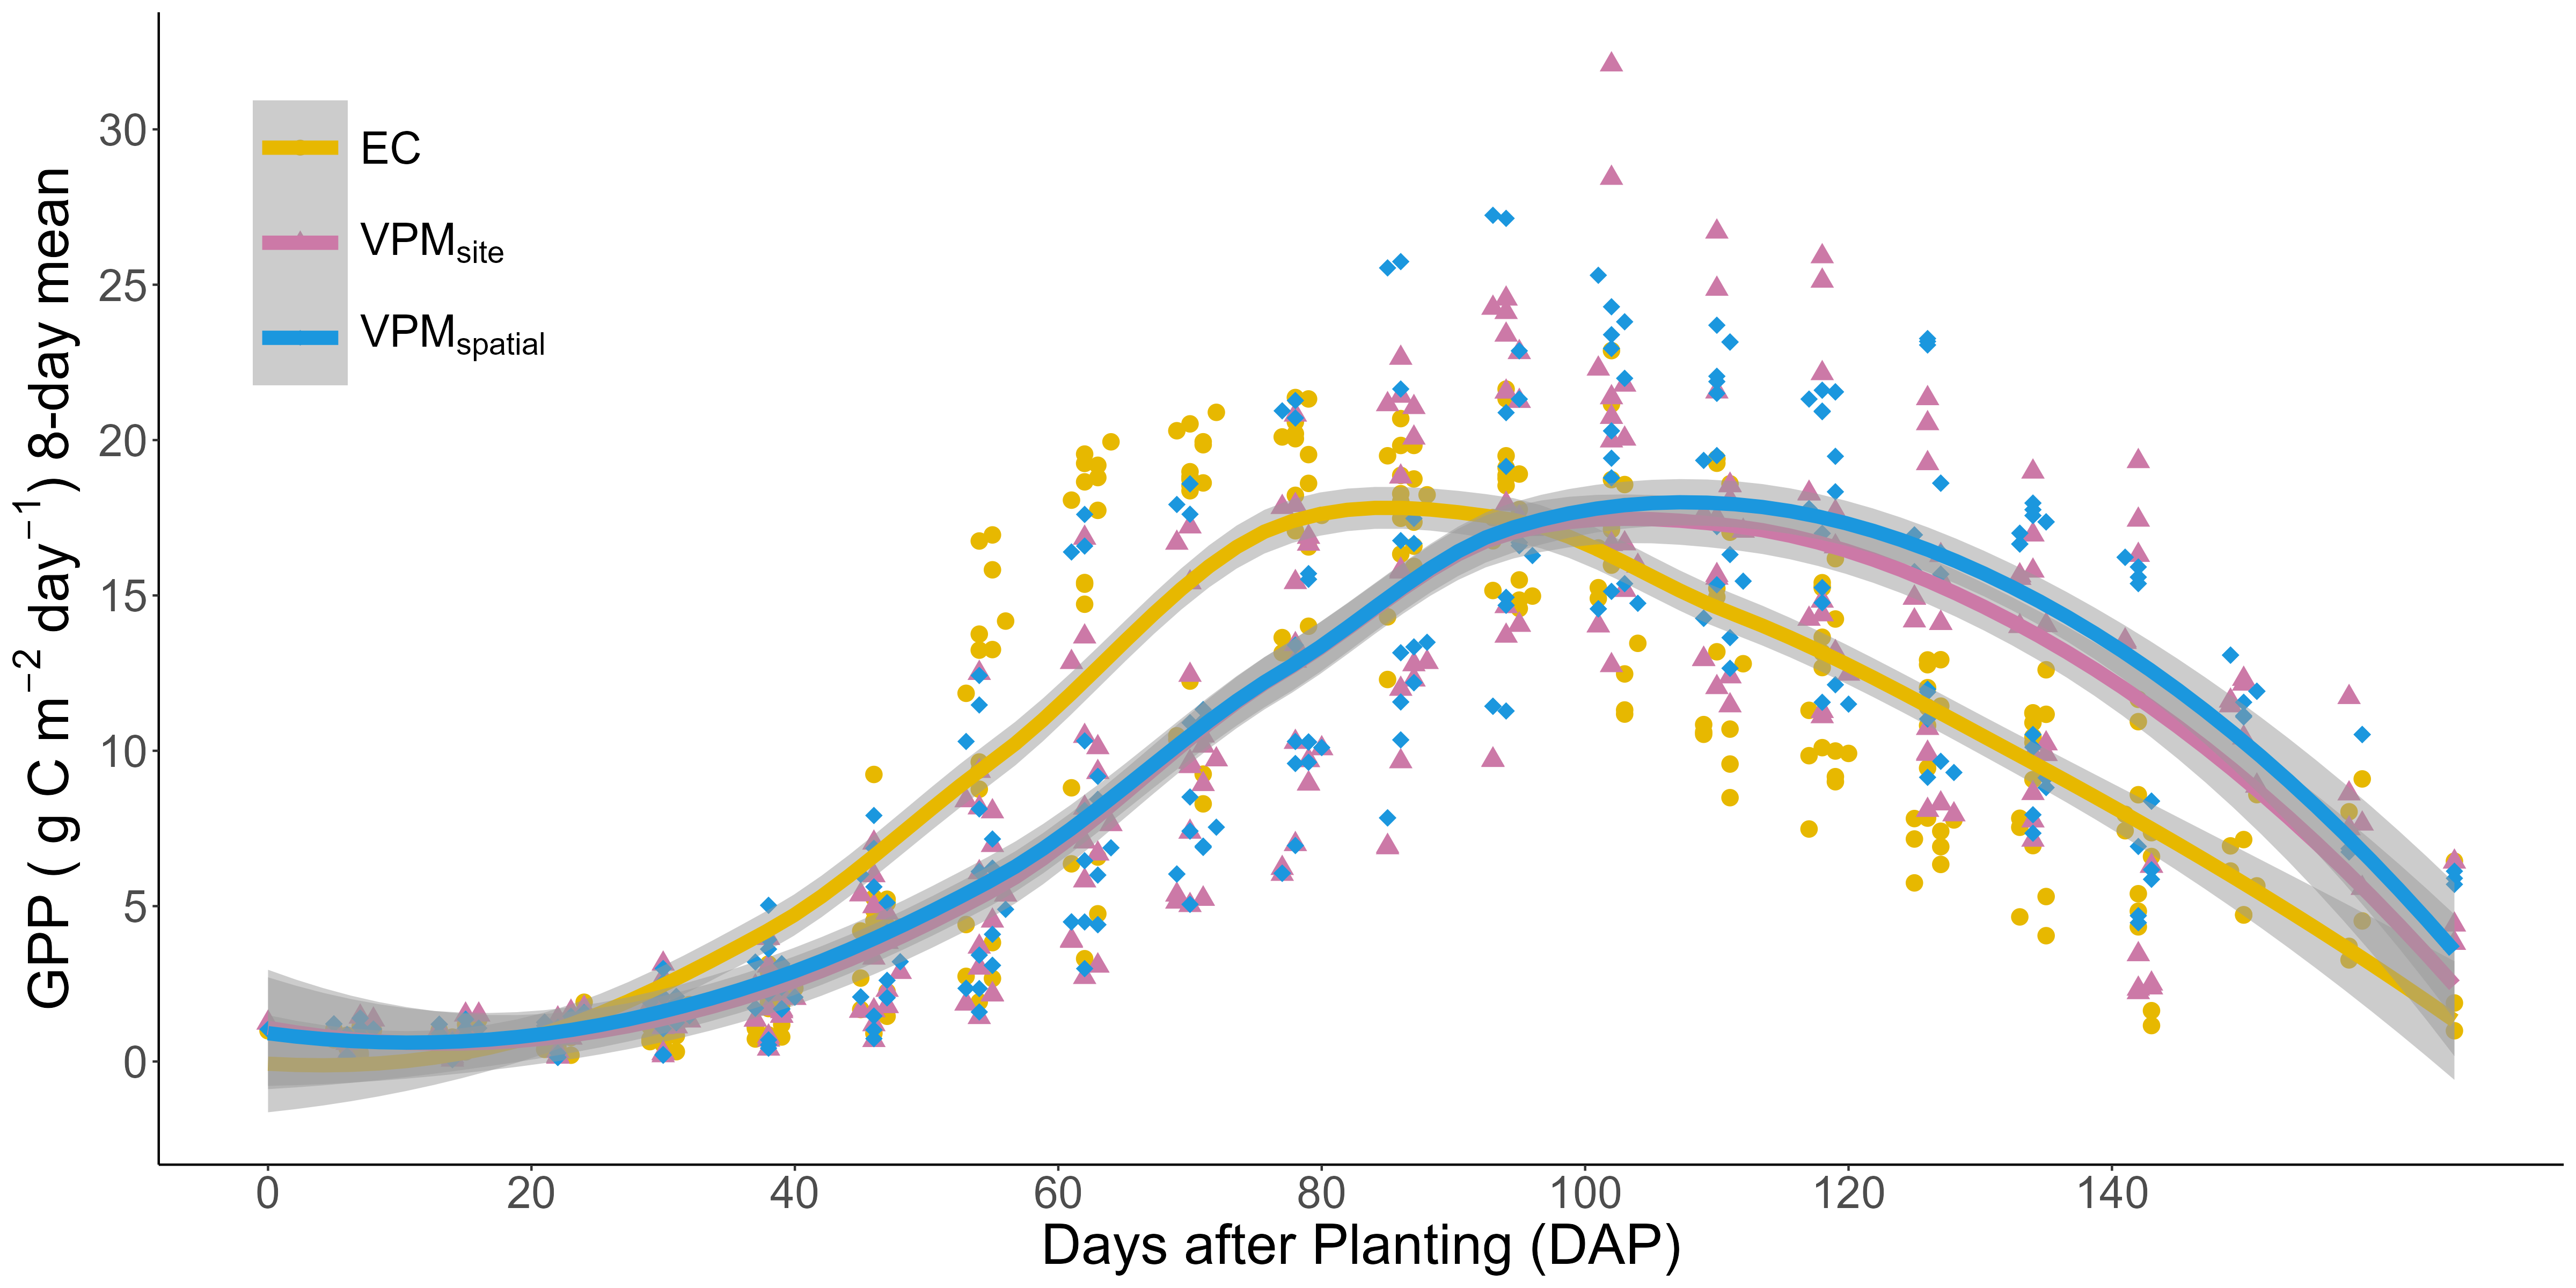
Time Series plot of GPP using three methods
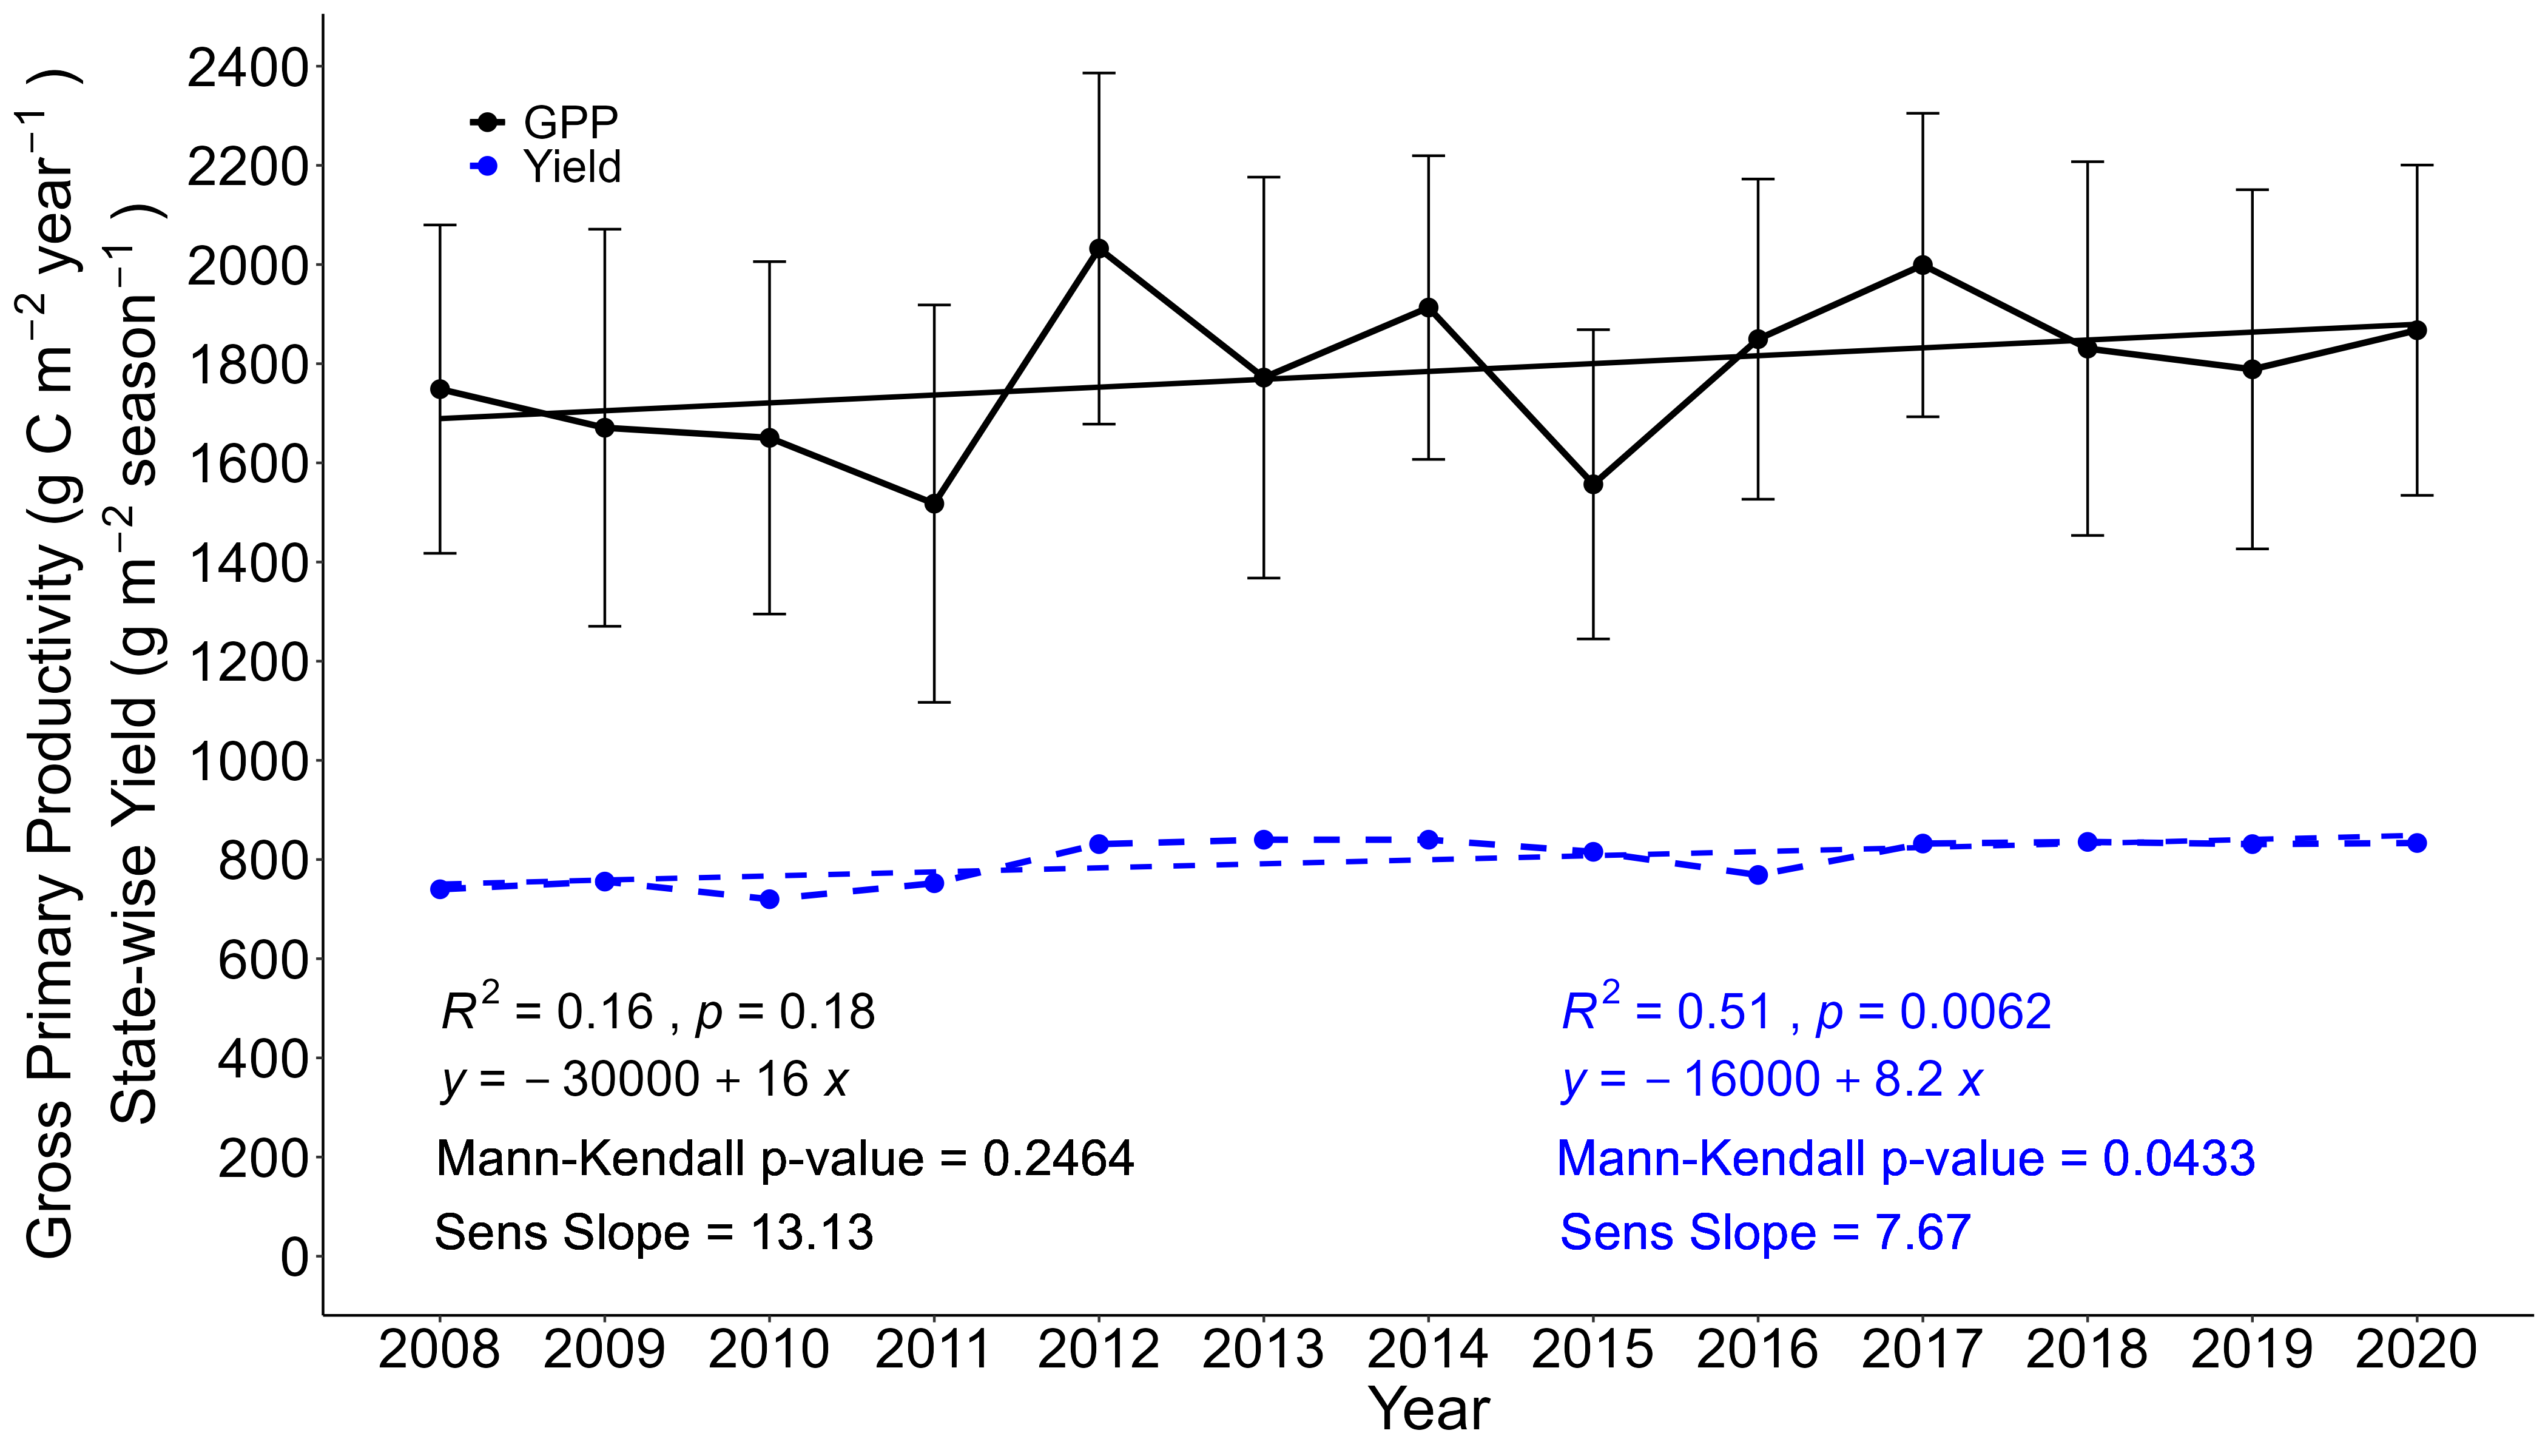
Interannual Trends of Yield and GPP
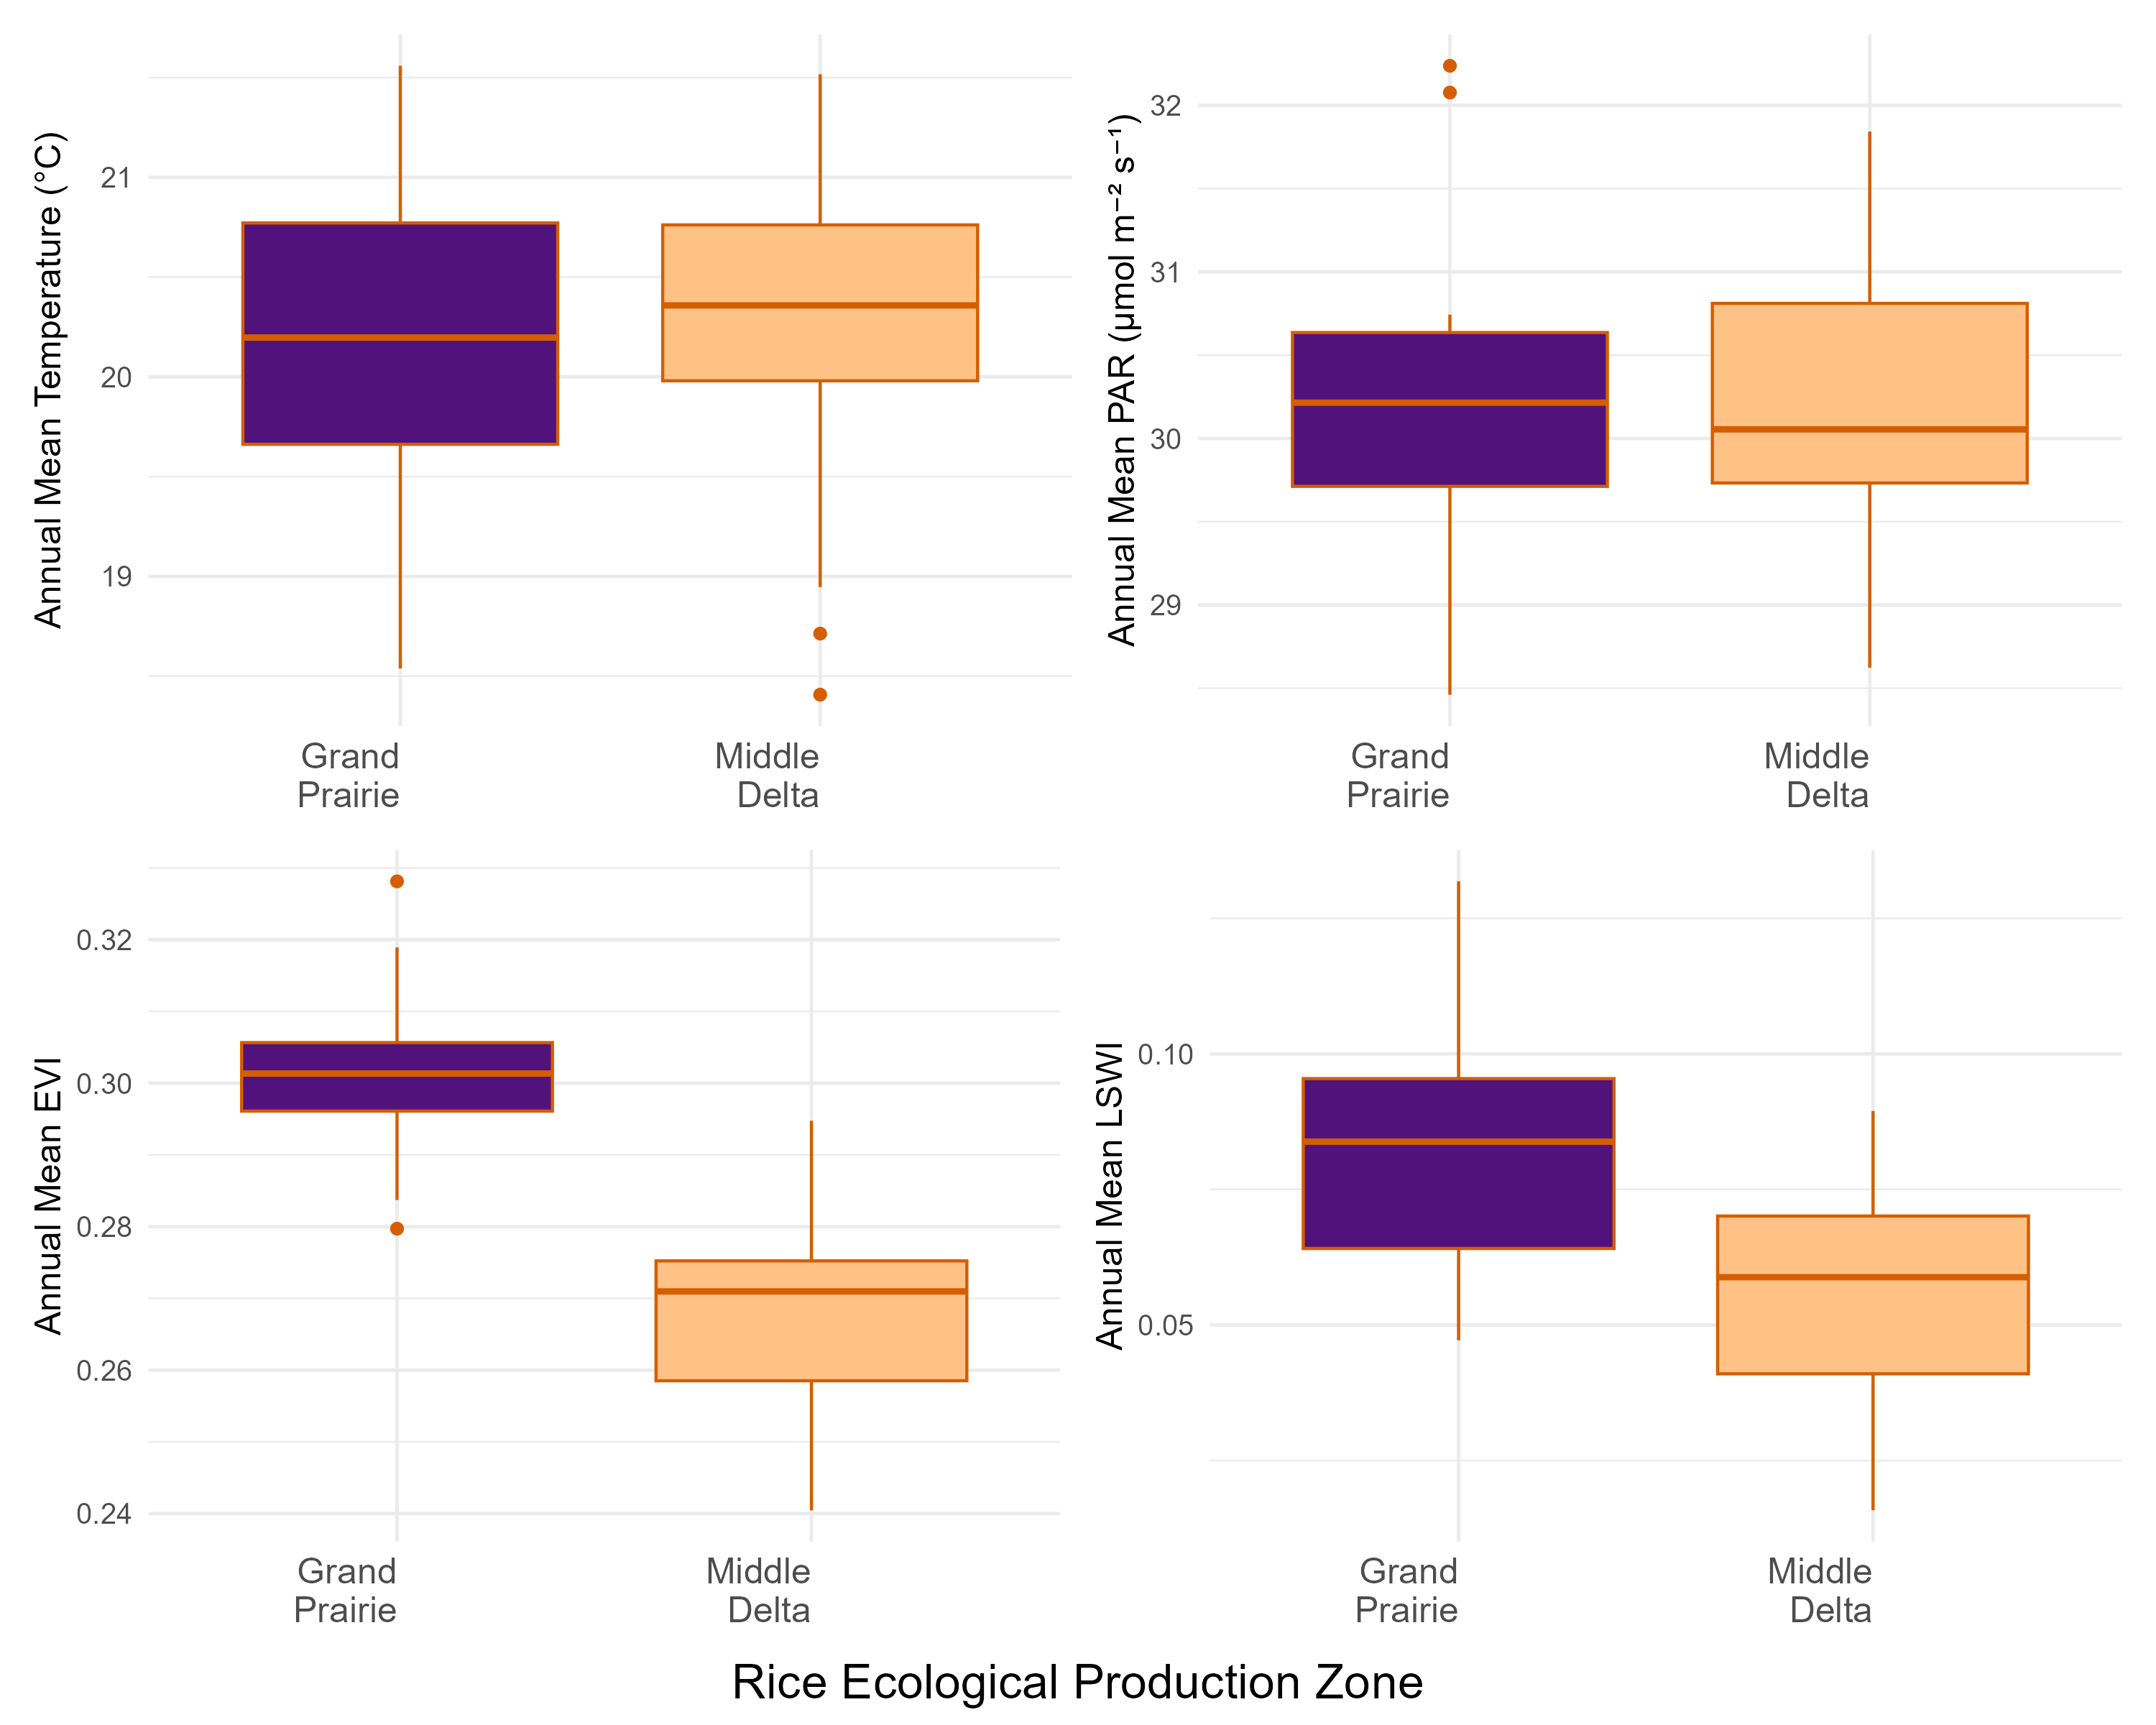
GPP Comparison of Rice Production Regions of Arkansas
LSWI Influence on GPP across Different Level of Clay Content
Histogram of the clay content of the rice fields in Arkansas How the relationship between water status and rice plant photosynthesis changes across clay content How the relationship between rice growing frequency and the residuals from the model of water status (LSWI) and rice plant photosynthesis changes across clay content 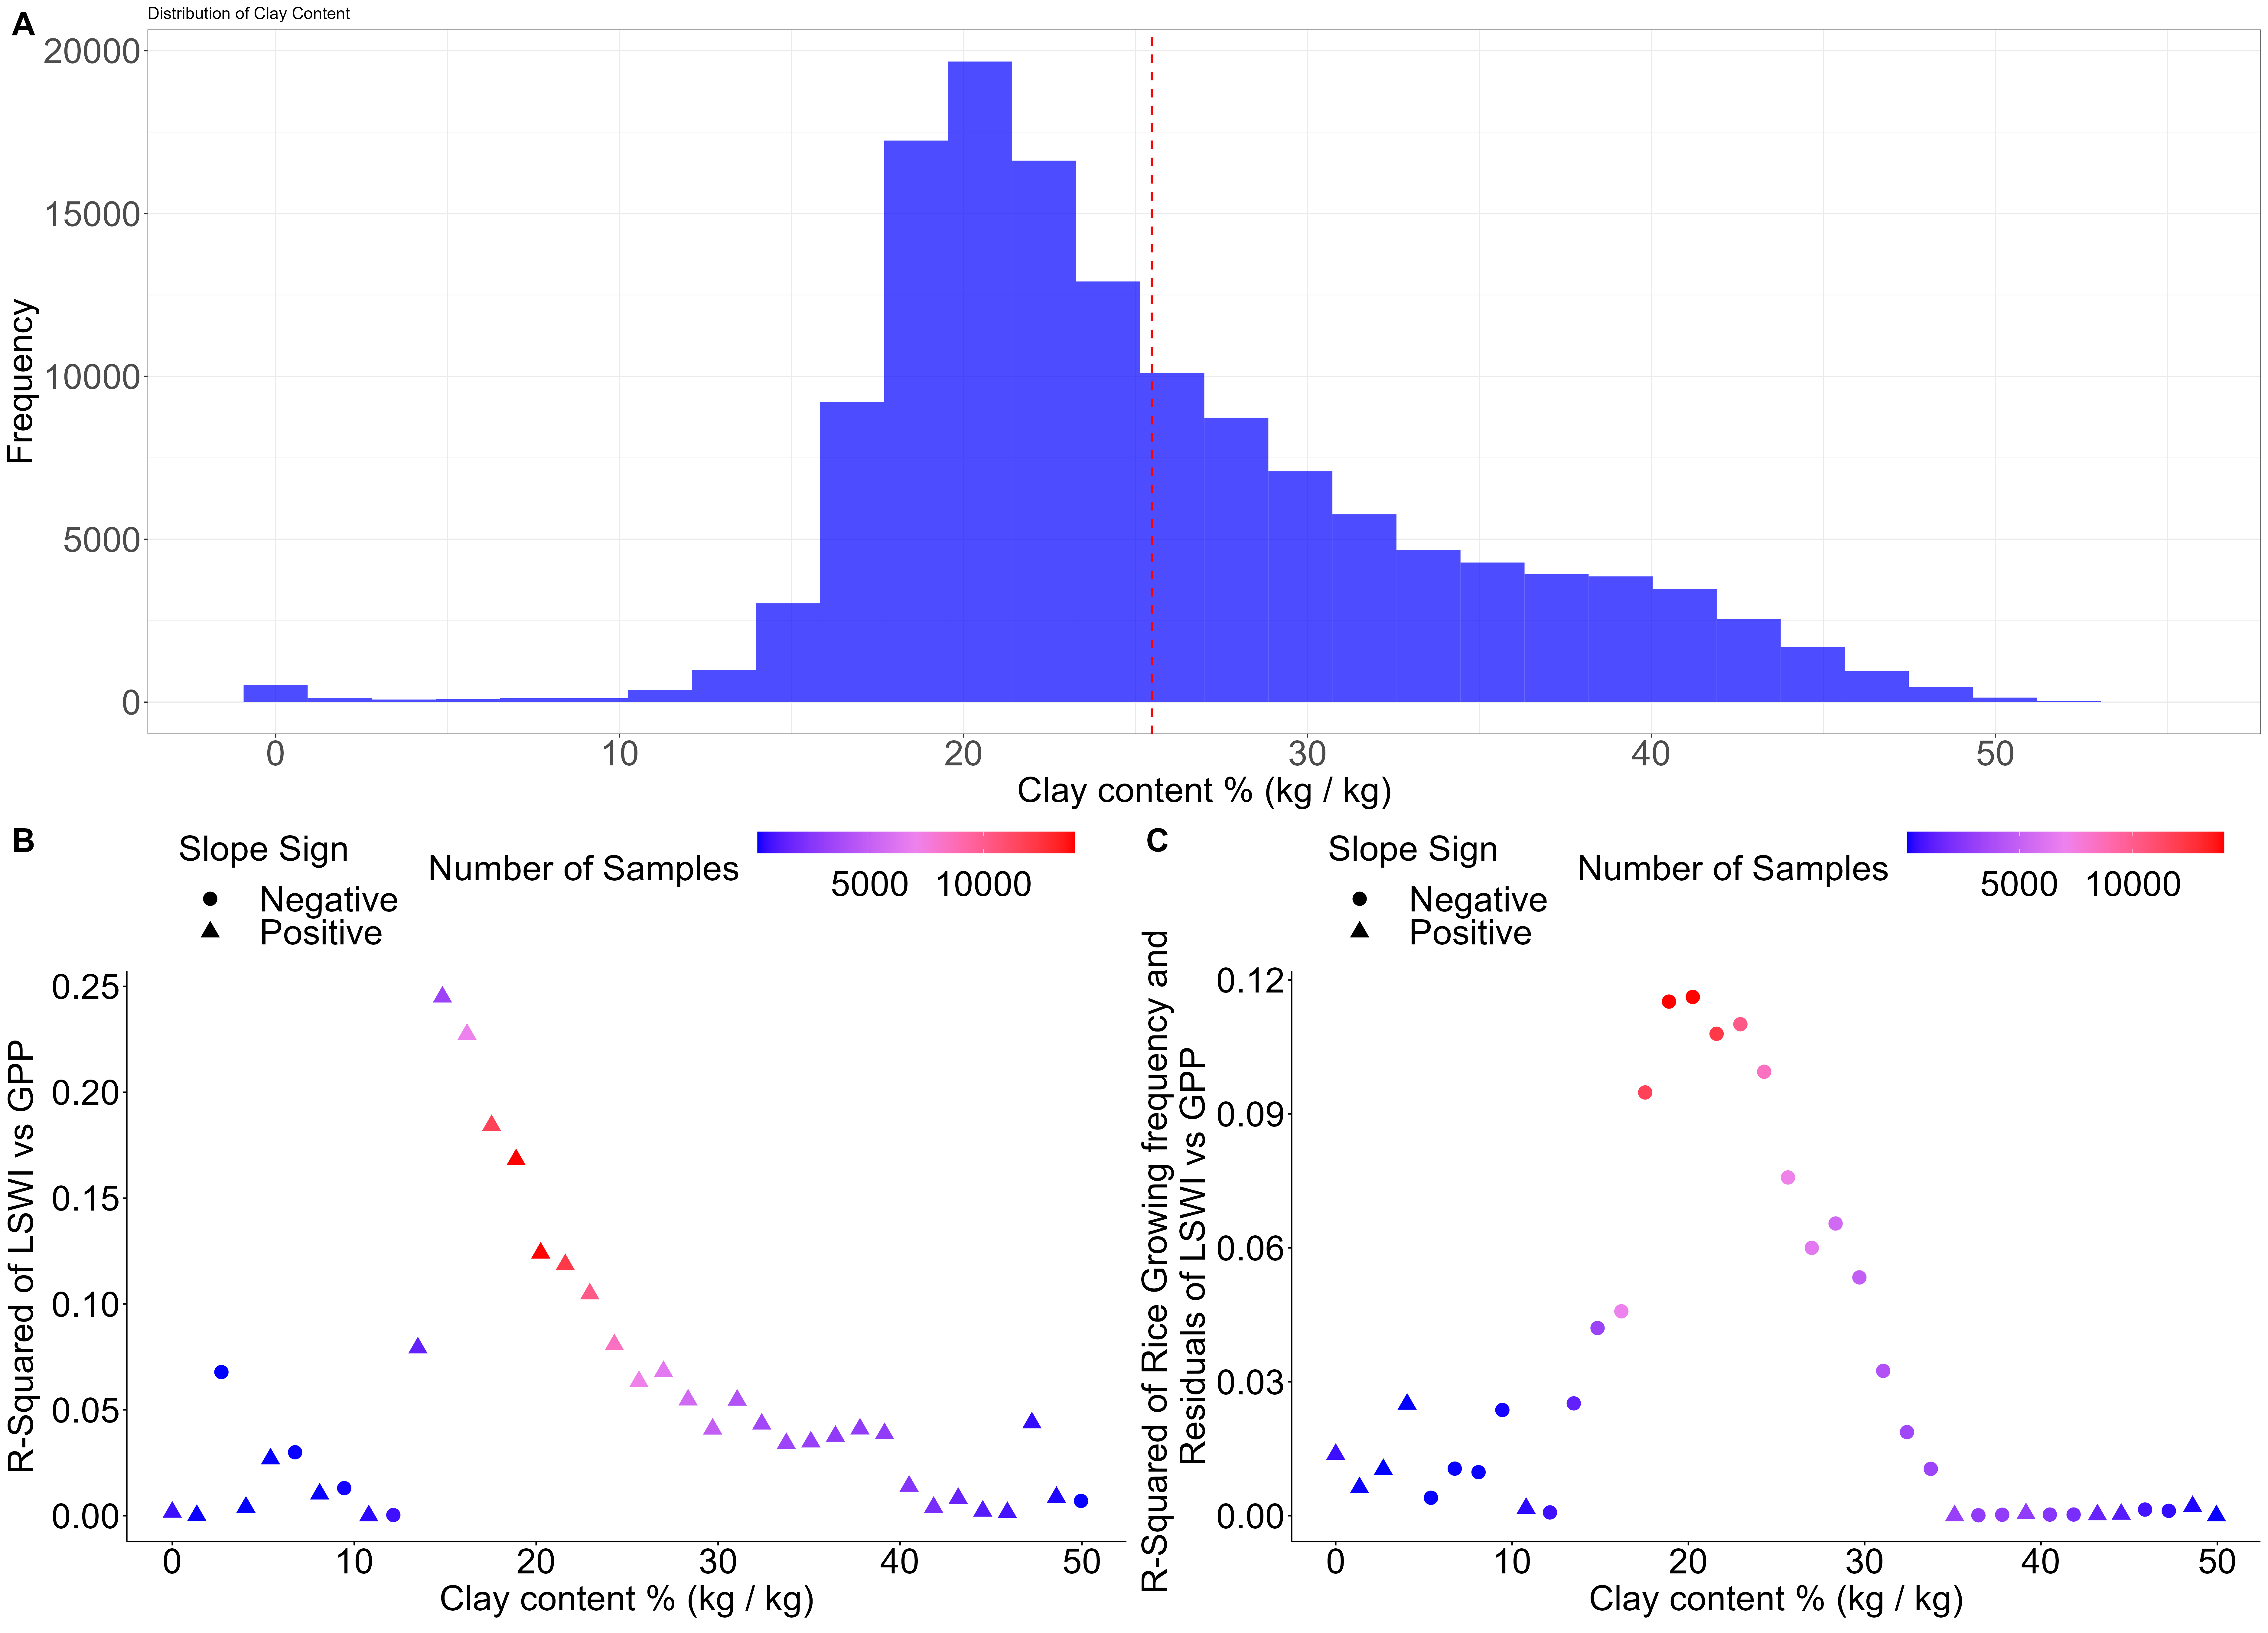
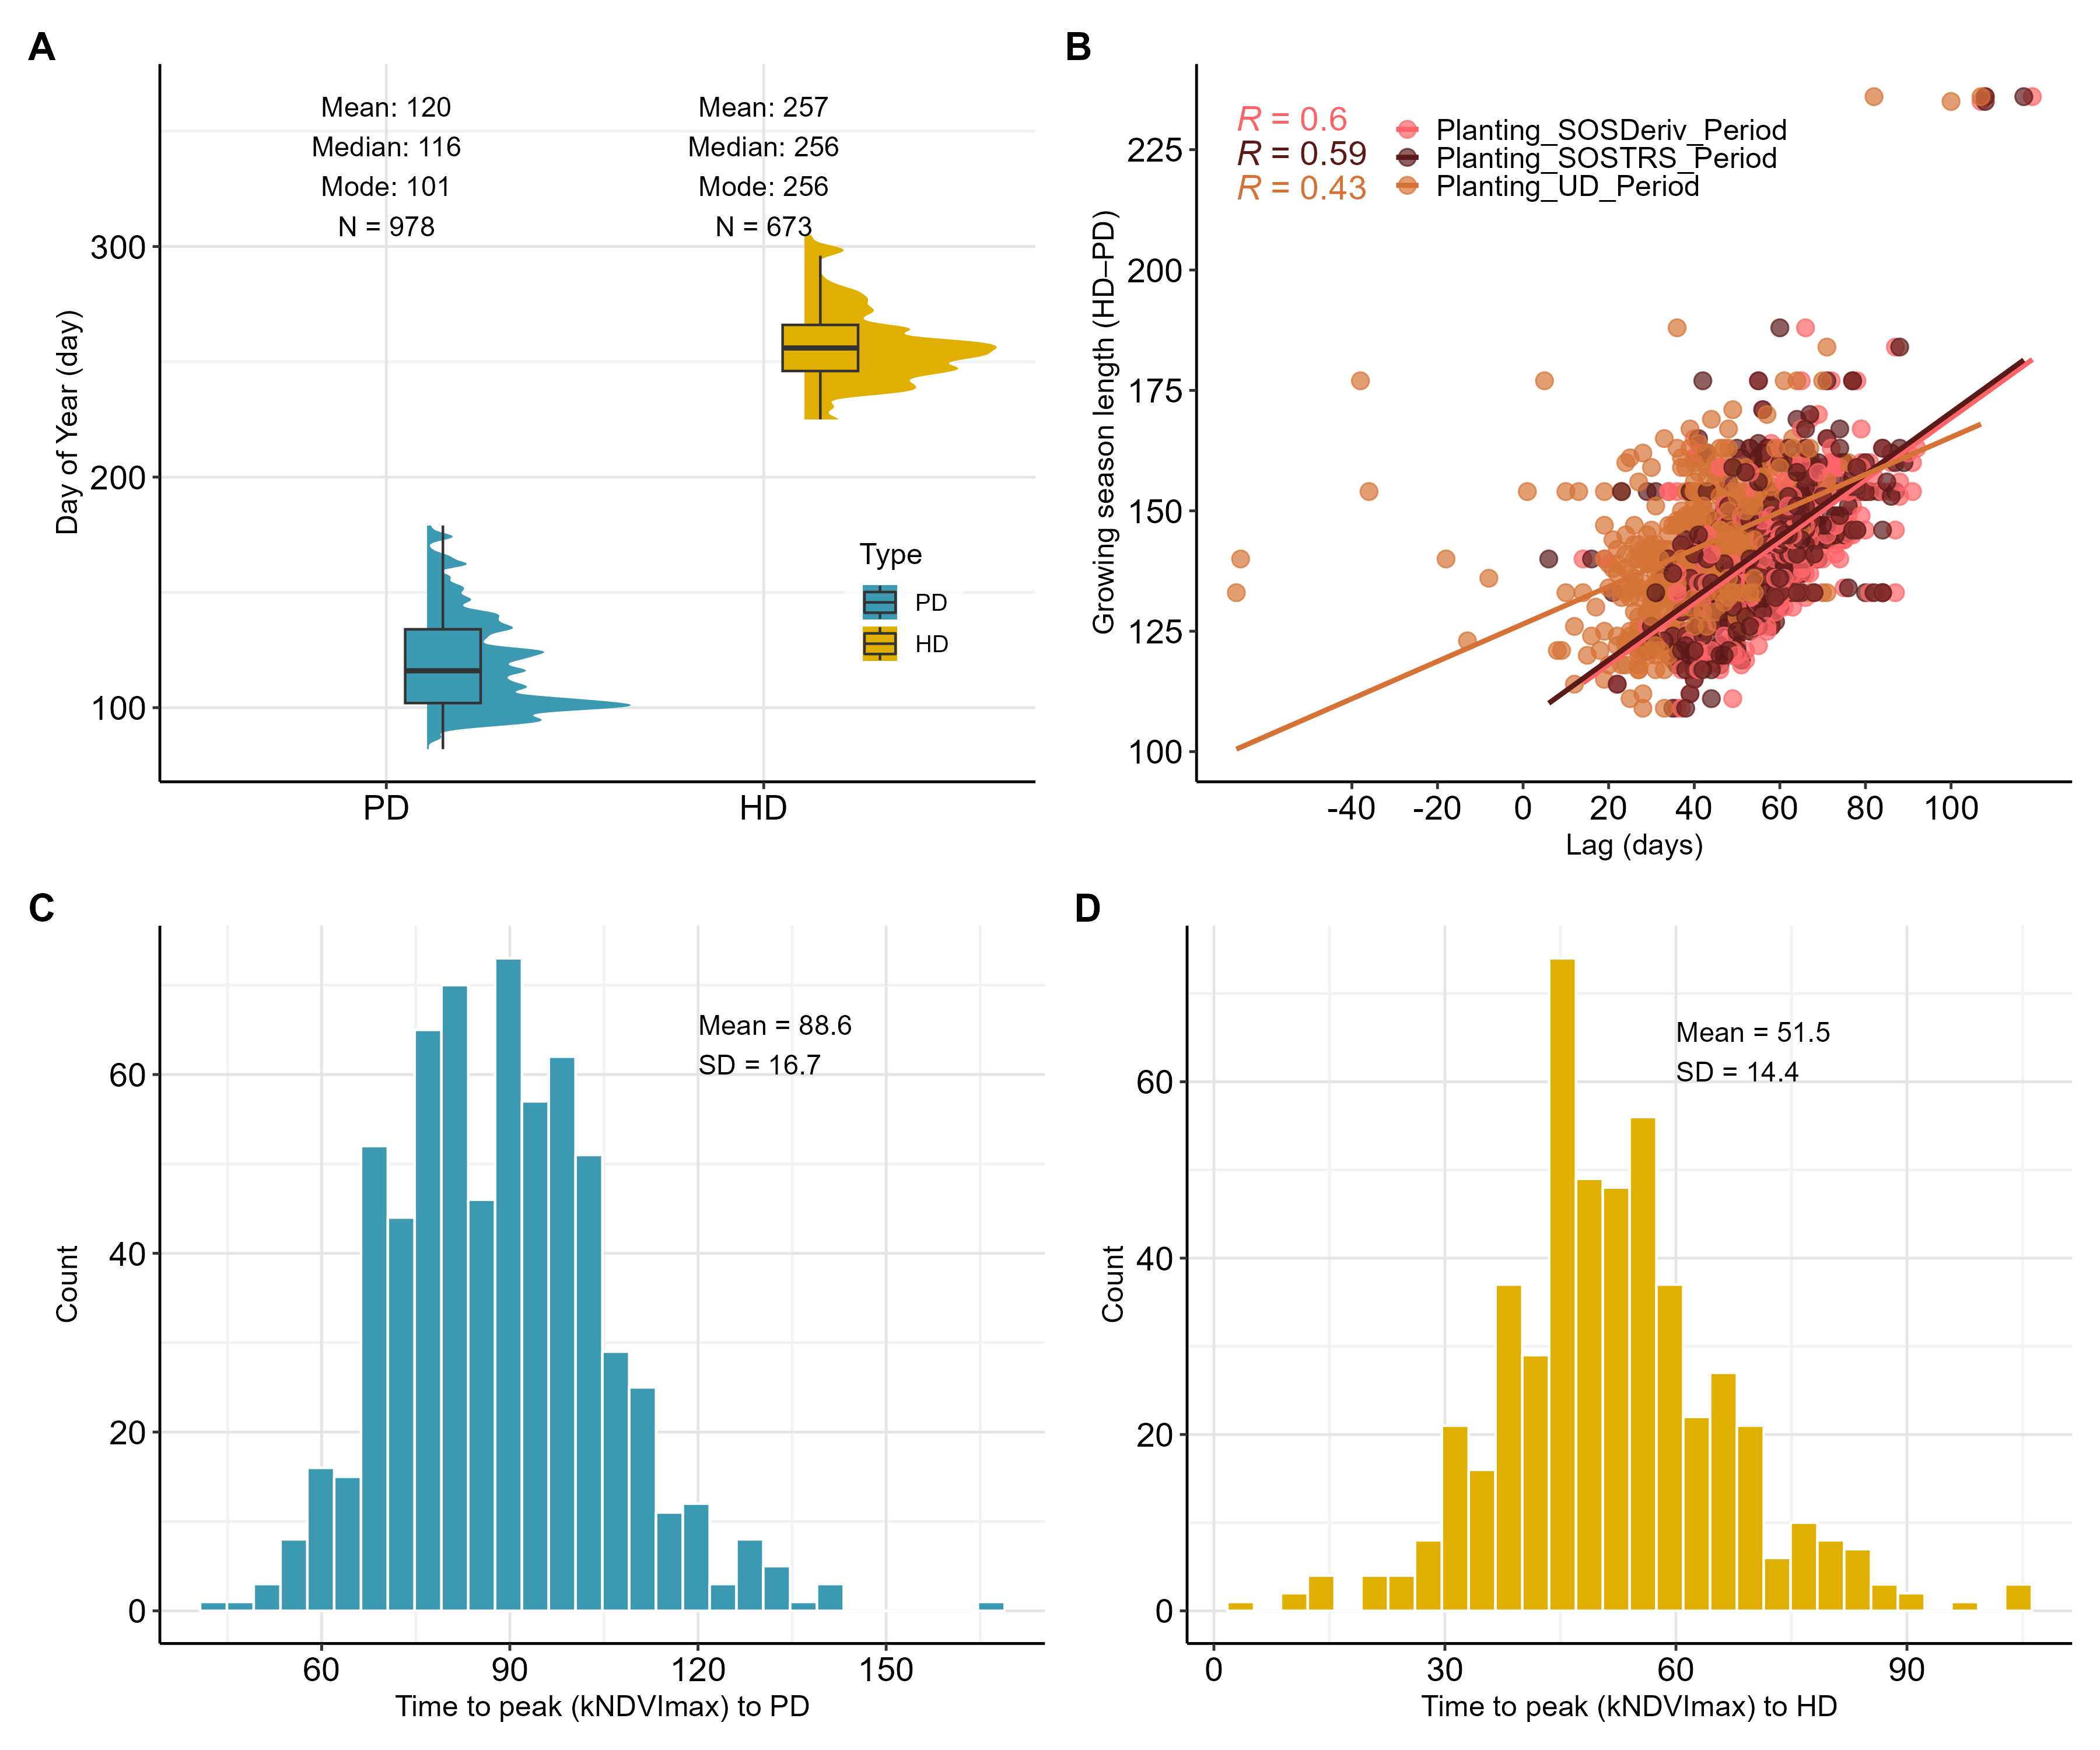
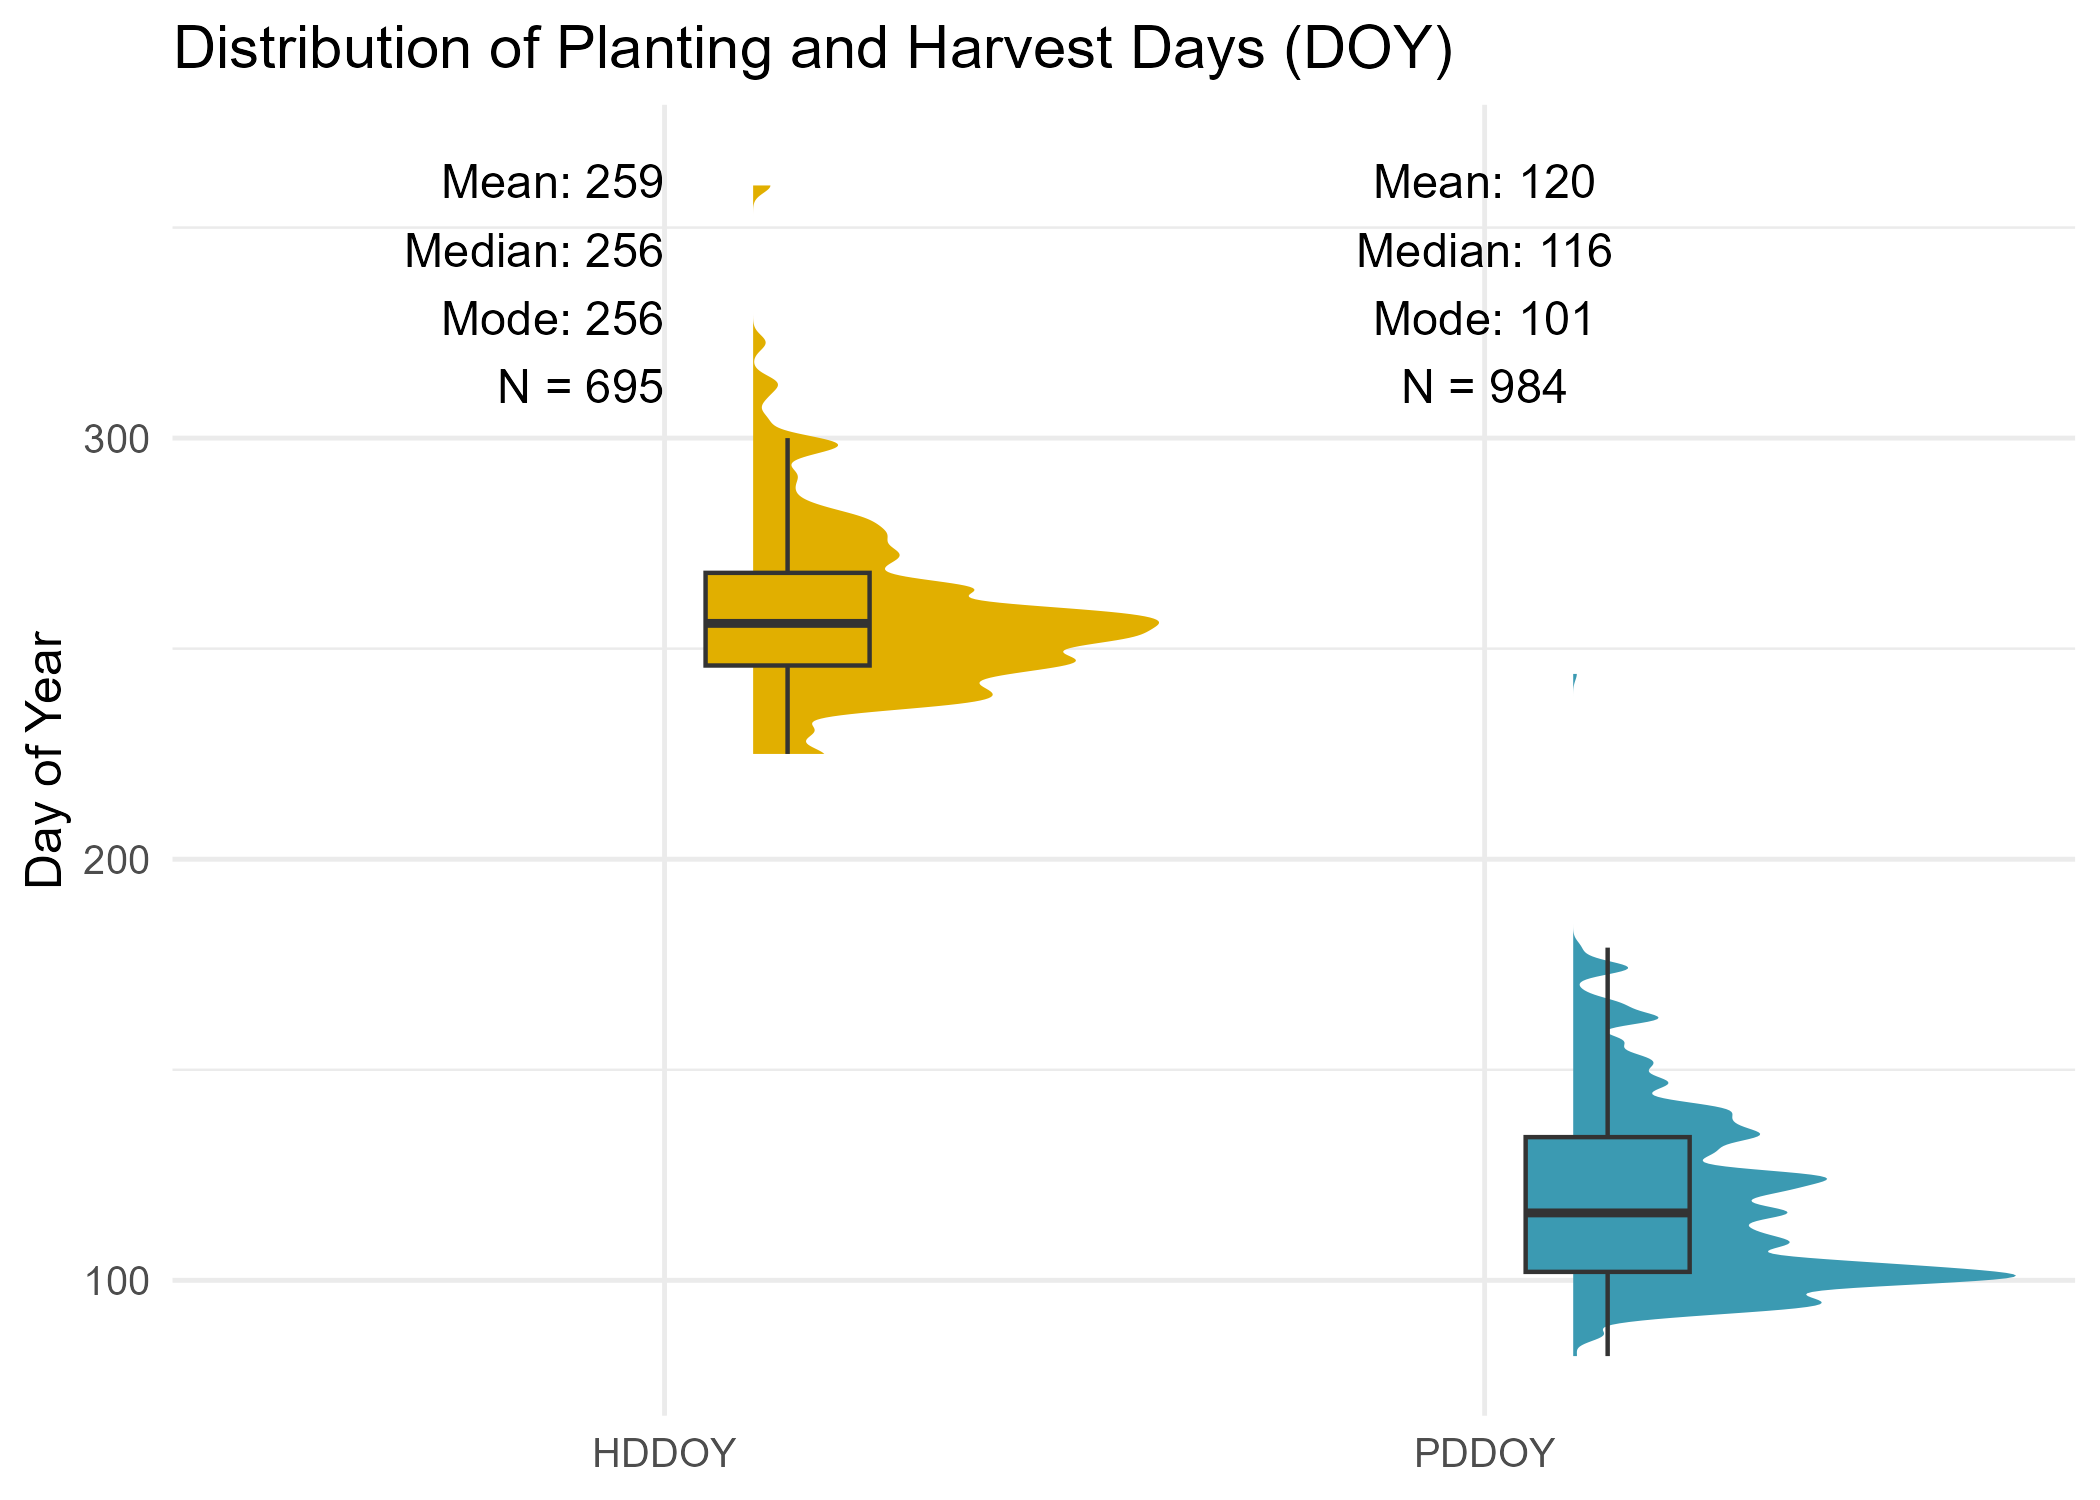
Planting & Harvest Date Distribution
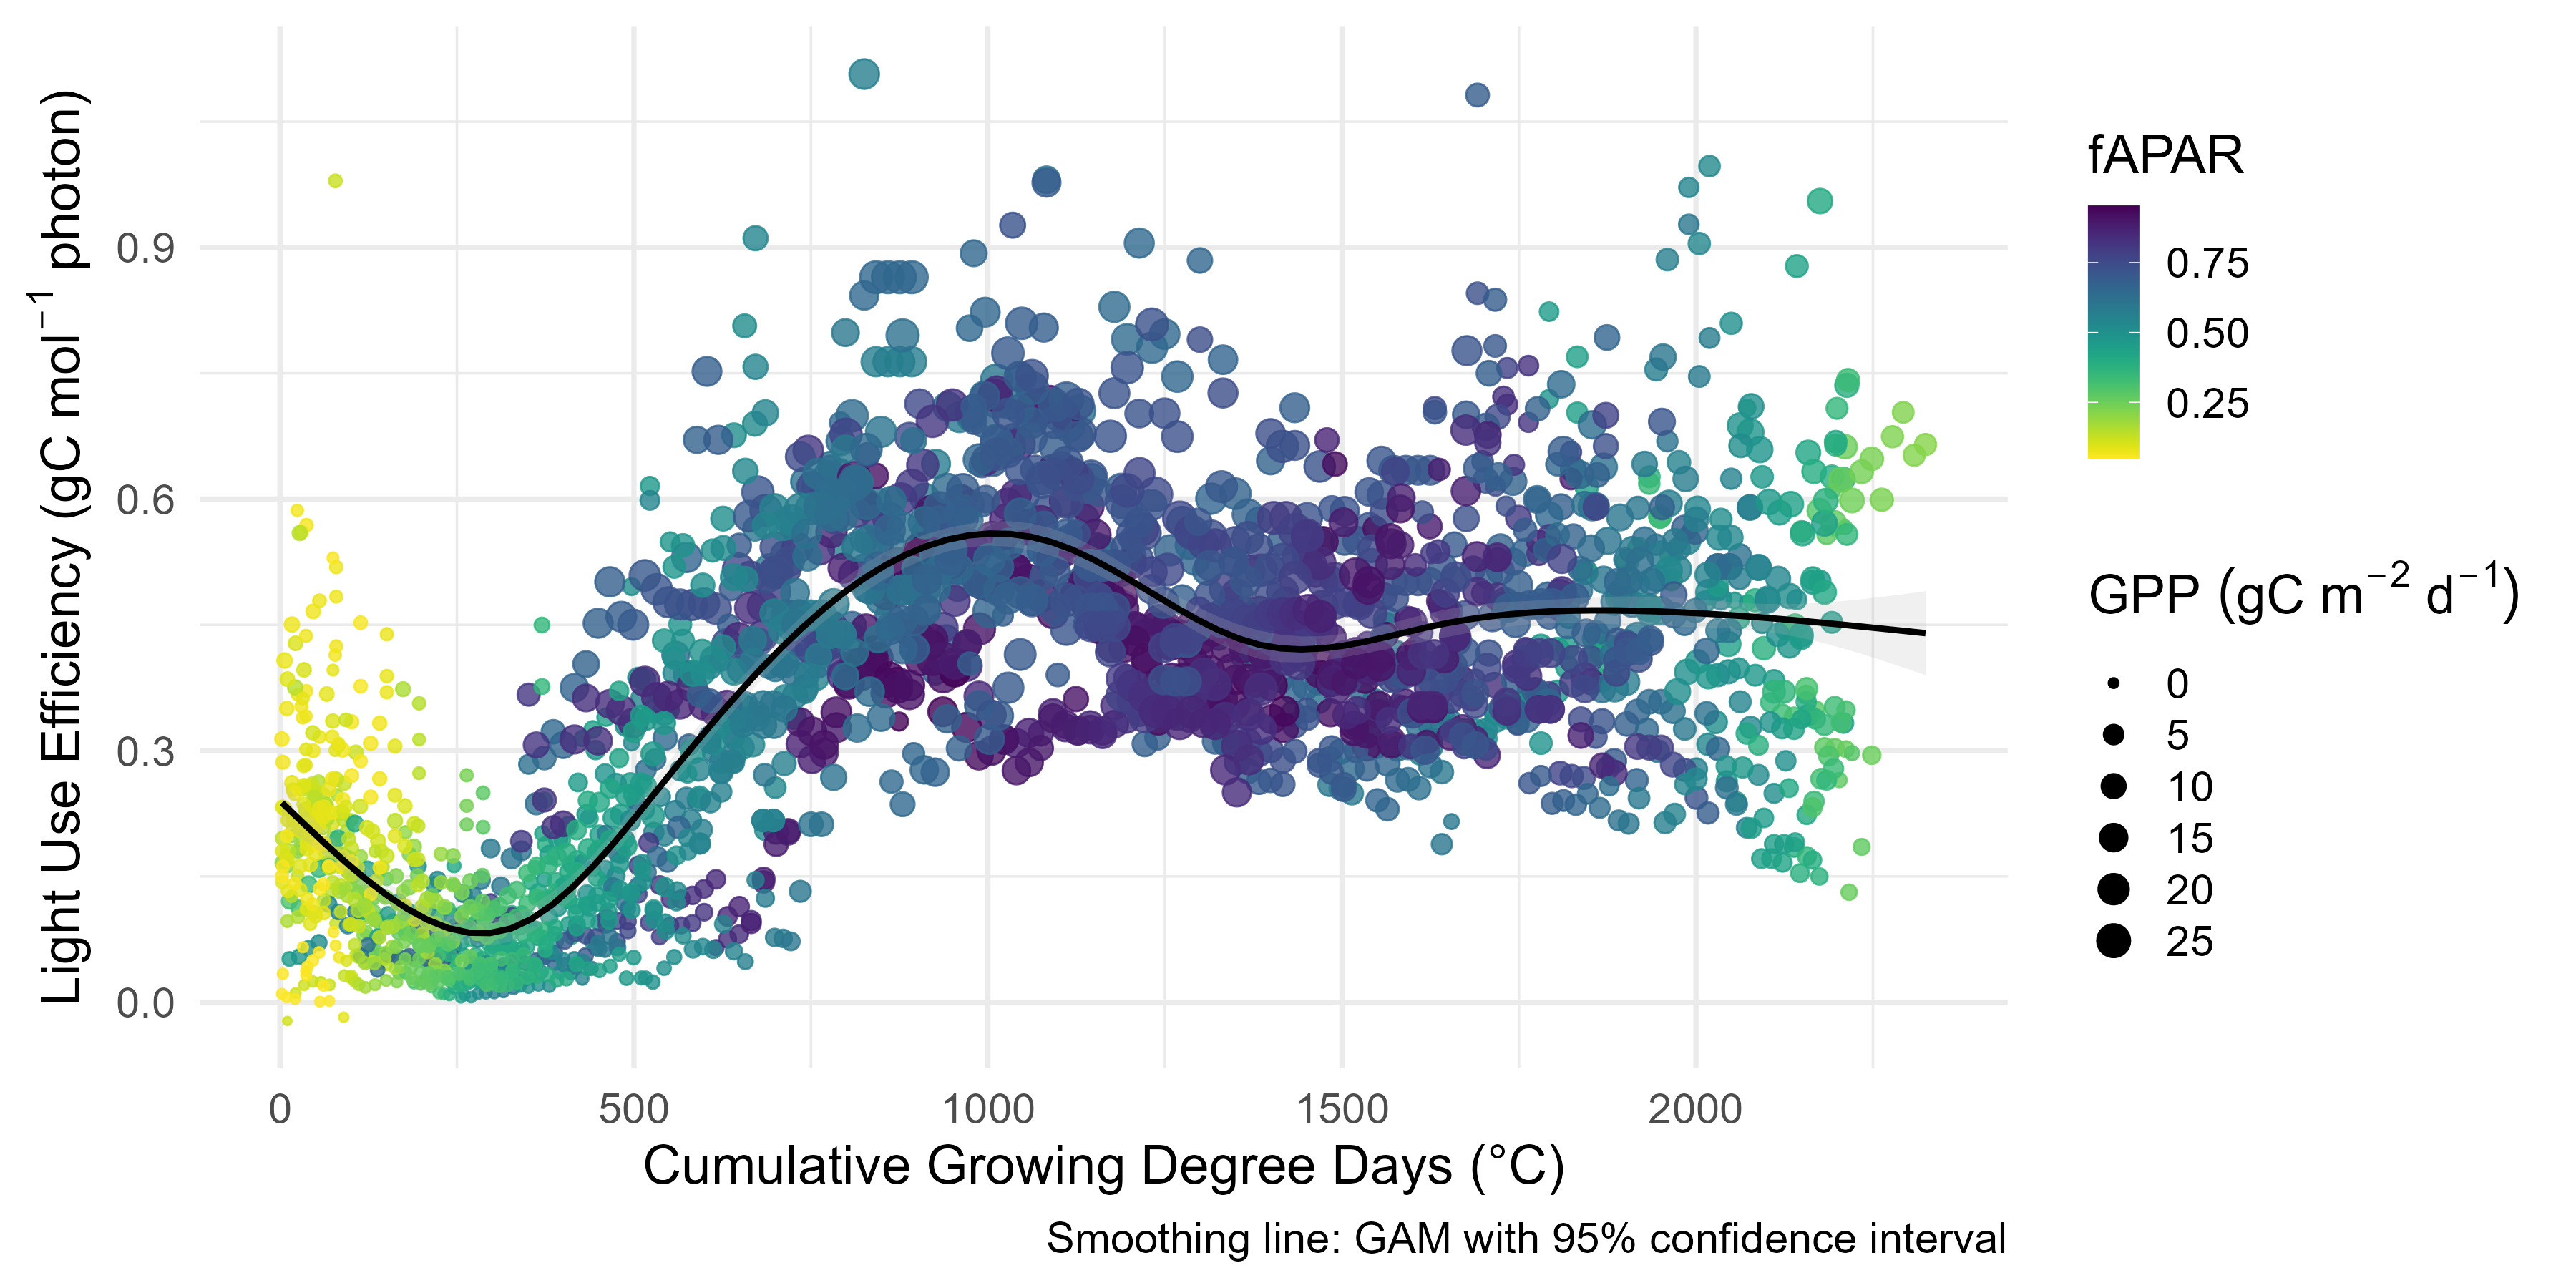
Light Use Efficiency Across Time
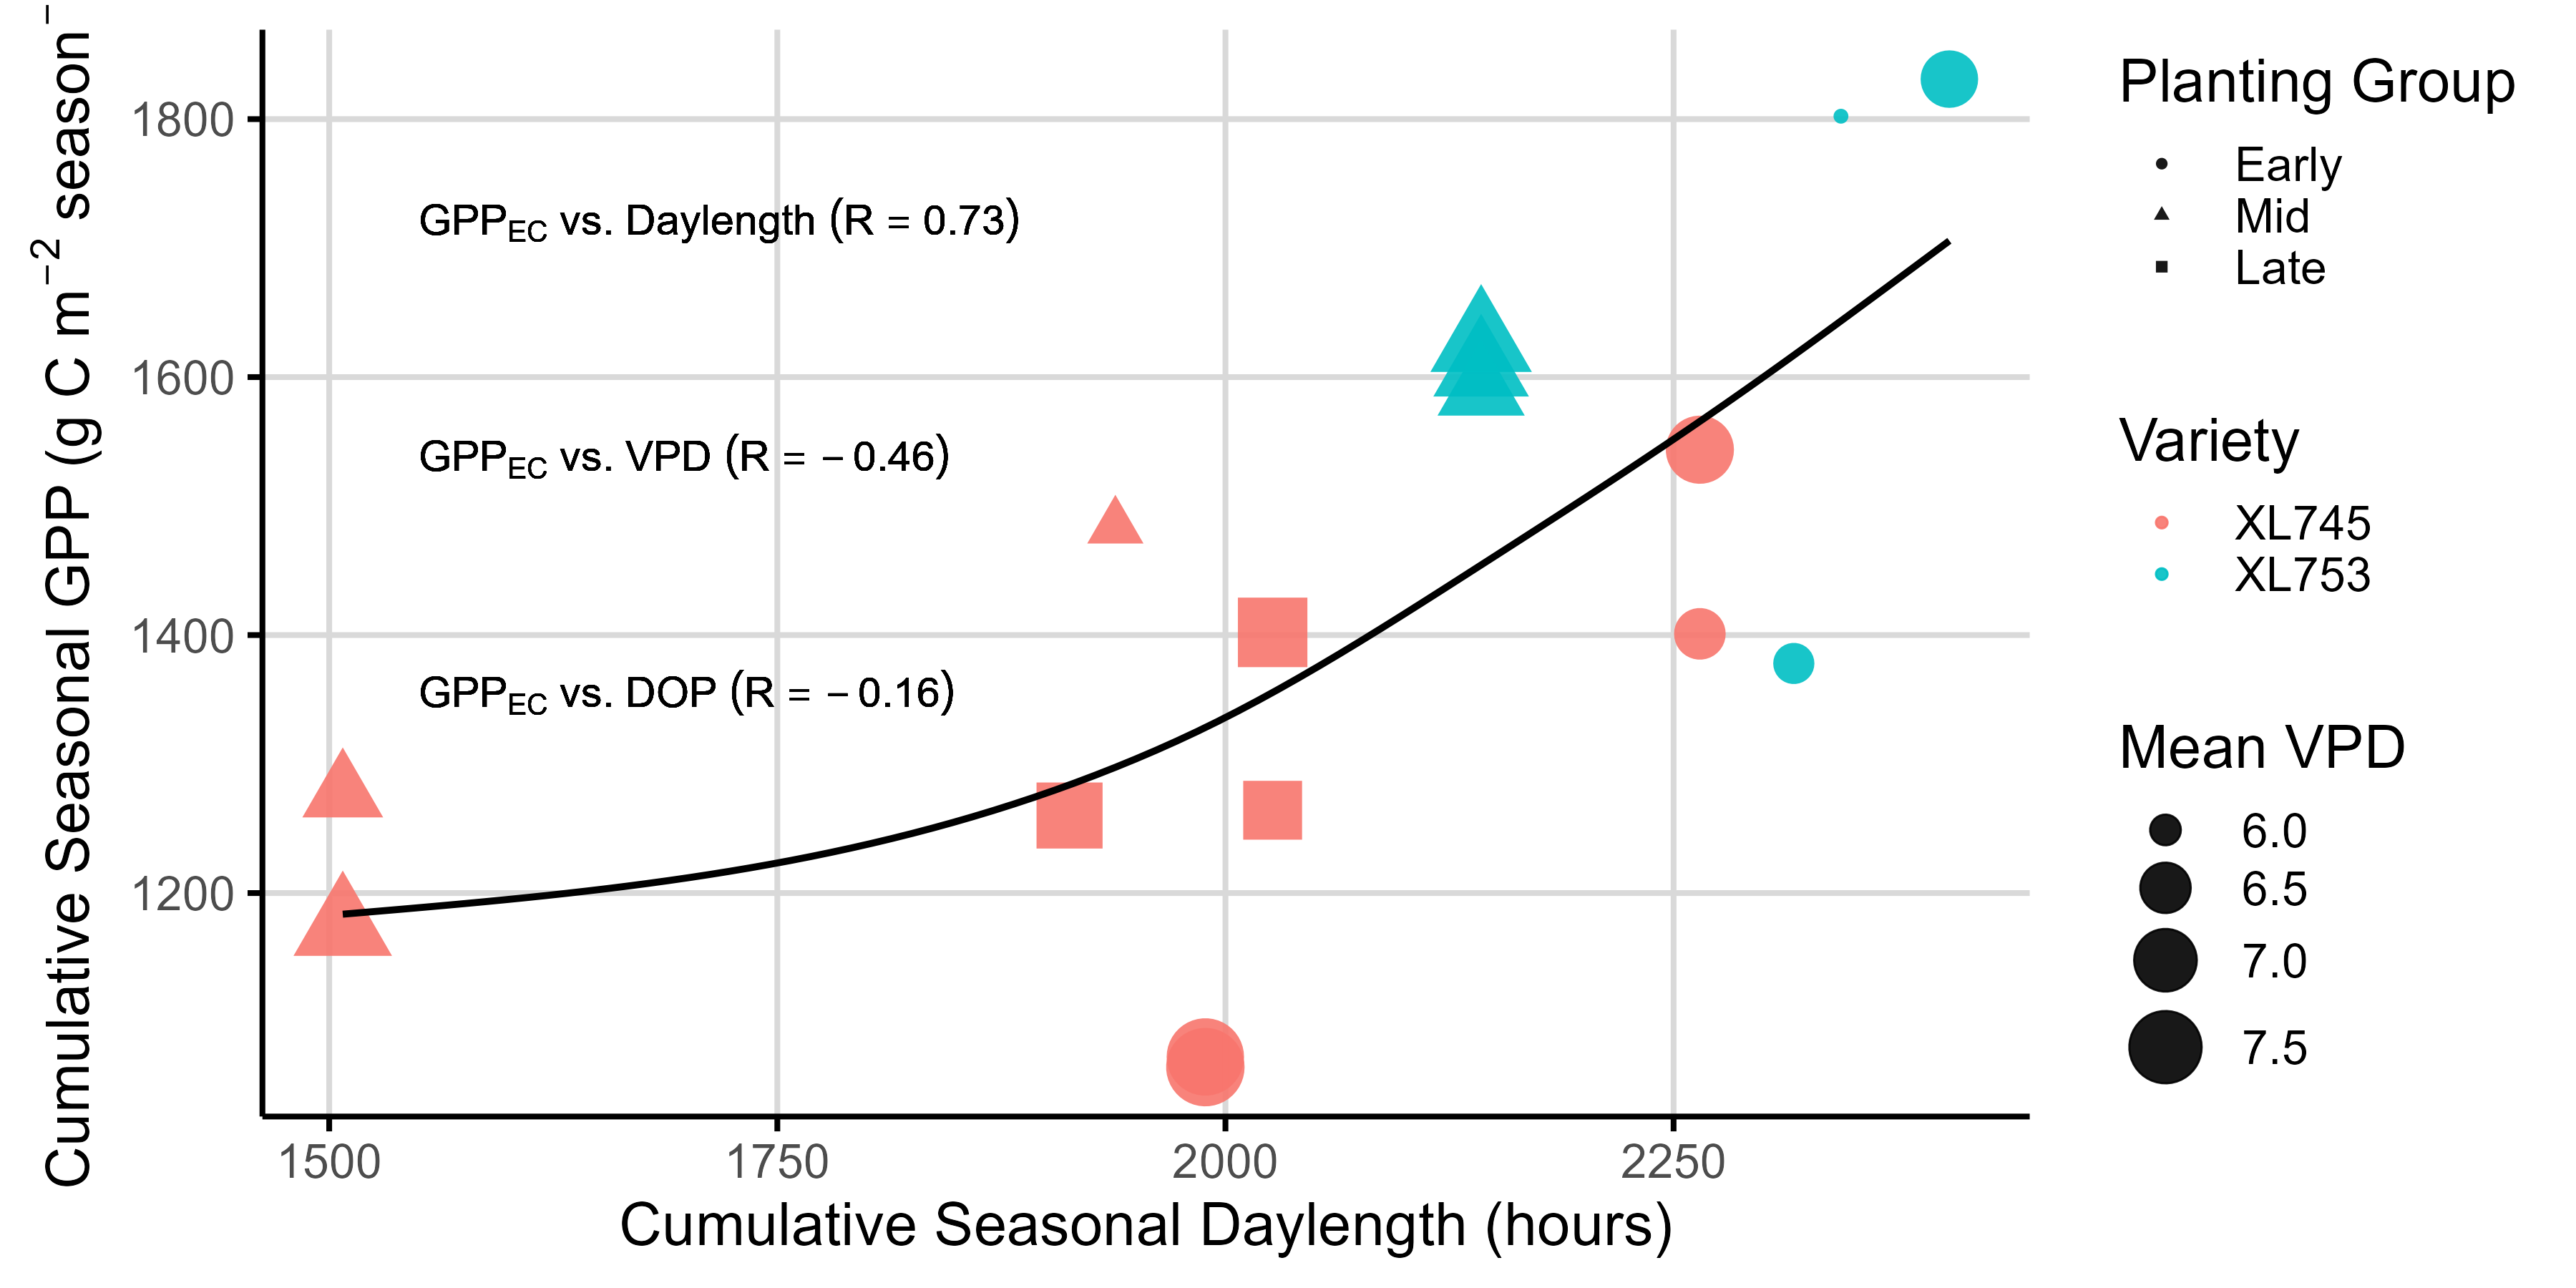
Factors Affecting GPP
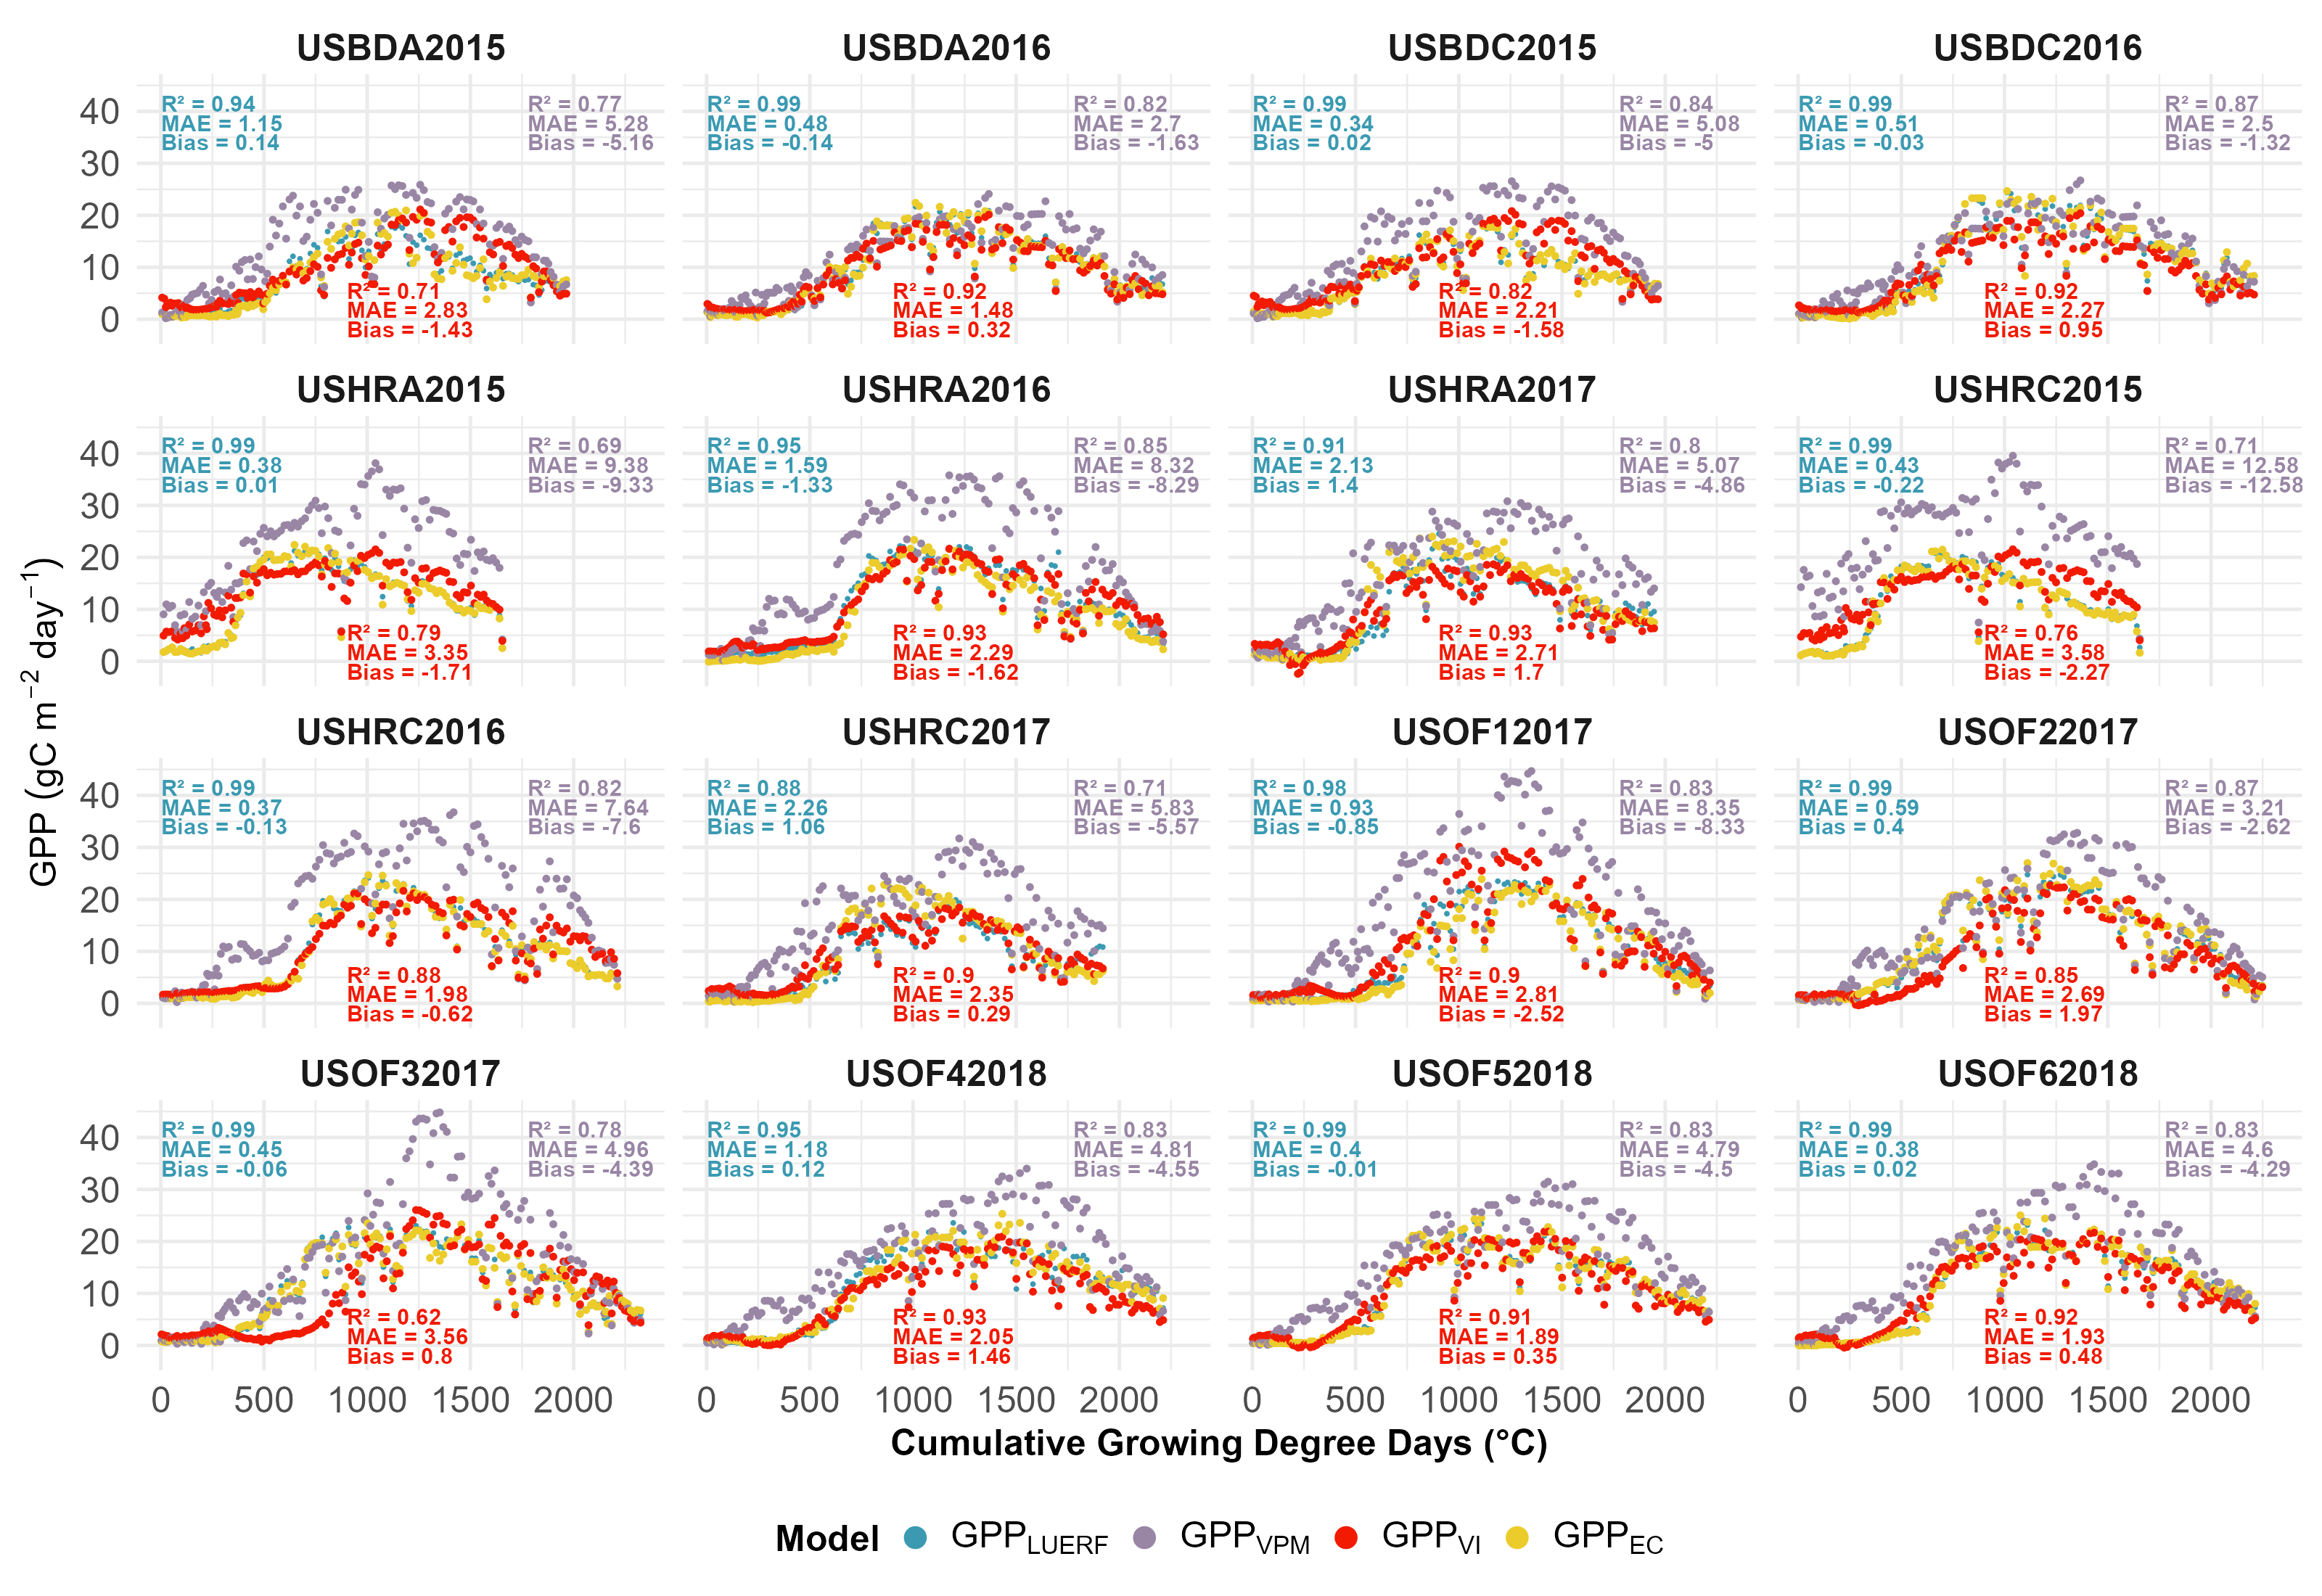
Temporal Dynamics of GPP Predicted by Different Models
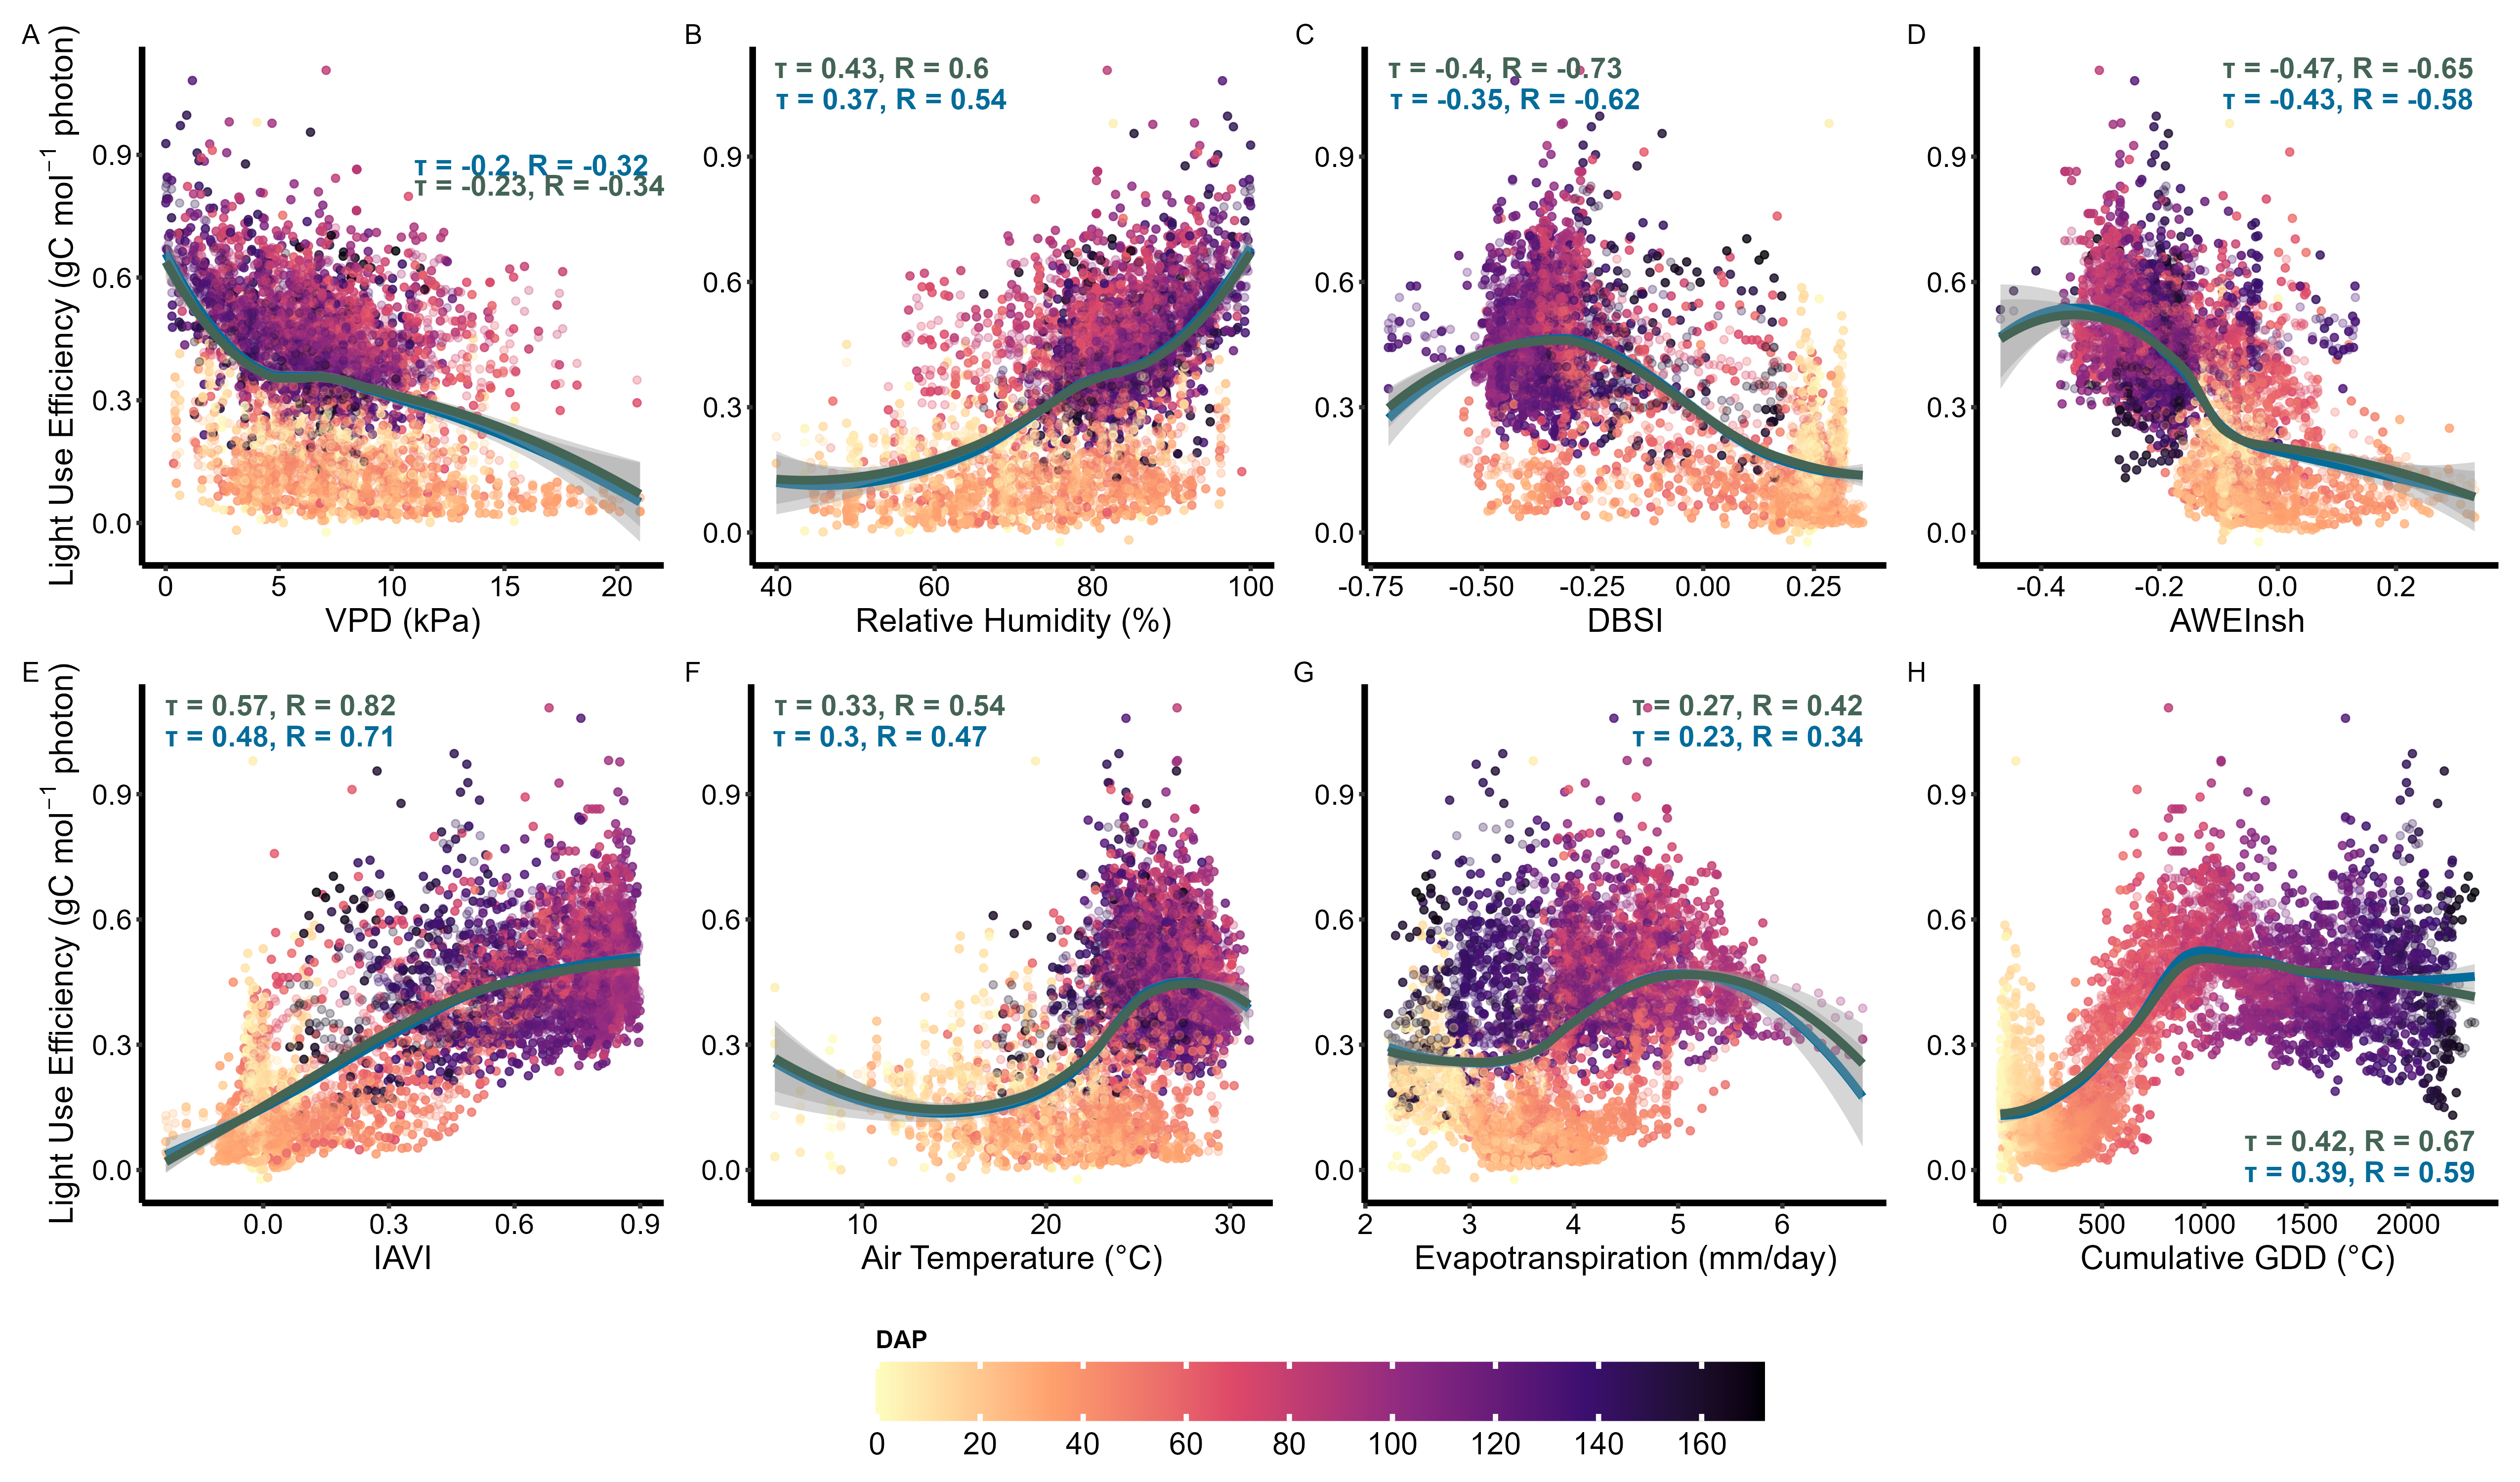
Scatterplot Relationship between LUE and Other Biophysical Factors
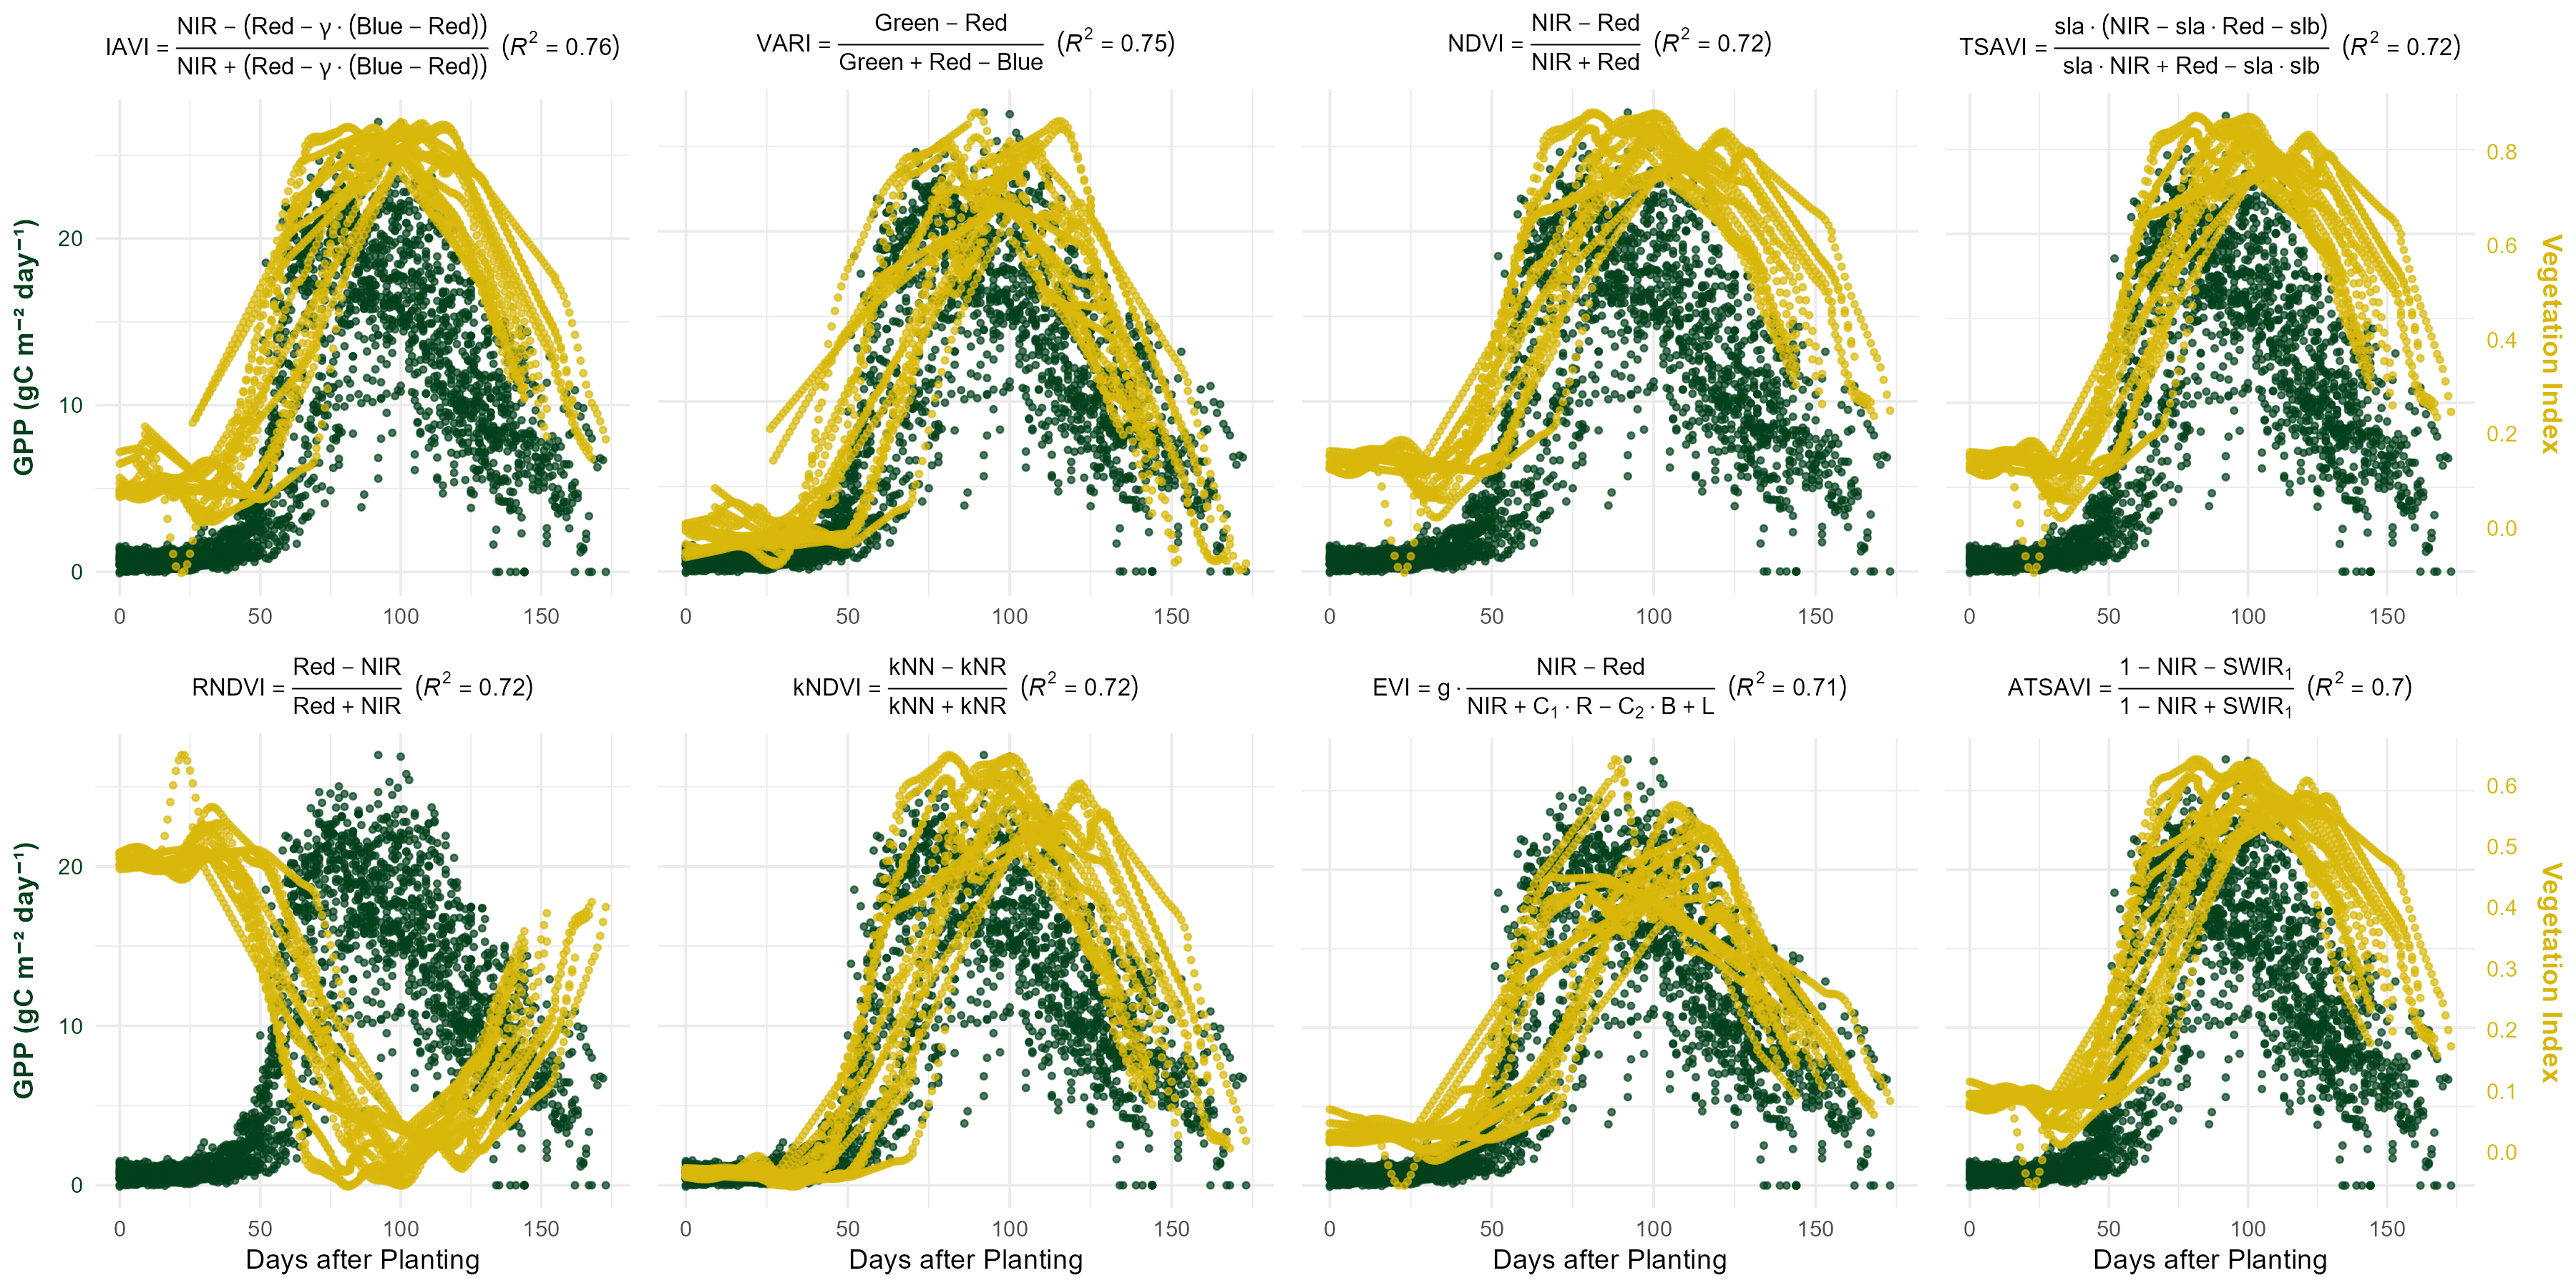
Relationship between GPP and Vegetation Indices
Harmonic Fit of kNDVI index from One Rice Field Analysis
Correlation Plot
This correlation shows pairwise correlation coefficients among planting/harvest dates, meteorological indicators, and vegetation indices derived from rice field observations. Strong positive correlations (yellow) are observed between phenological indicators such as start of season (SOS), end of season (EOS), and thermal variables (Growing degree day, soil temperature). In contrast, weaker or even slightly negative correlations (darker tones) appear between average soil organic carbon and most other variables, suggesting limited influence.
The plot was created using ggplot2 in R, which provides flexible tools for visualizing correlation matrices with customized color scales, annotations, and triangular layouts.
Project Workflow and Predictive Modeling Framework for Spatial GPP, Growing Season Length, and CH₄
Flux in Arkansas Rice Paddies
This project employs a four data sources (ground truth eddy covariance data, gridded environmental spatial data, satellite reflectance data, and rice land cover data) to estimate state scale methane (CH₄) flux and predict key agricultural metrics: Phenological Date (PD), Harvest Date (HD), and Gross Primary Productivity (GPP).
The framework is divided into two phases:
1. Site-Scale Validation and CH₄ and GPP Estimation (Purple Domain):
This phase focuses on collecting ground truth data from specific sites (Eddy Covariance flux, PD/HD, climatology). The data is preprocessed, gap-filled, and used primarily to calculate the annual CH₄ flux and GPP and to provide essential validation inputs for the broader model.
2. State-Scale Predictive Modeling (Blue Domain):
This phase integrates three main data streams:
- Satellite Data (Sentinel, Landsat, MODIS) to derive vegetation indices
- Spatial Datasets (Temperature, Soil, Agronomic data)
- Rice Cropland Data Layer
All inputs are preprocessed and fed into the predictive model at the site scale, which forecasts PD, HD, and GPP across the state. The model’s results are validated against the ground truth PD/HD data.
The project concludes with an analysis of the predicted GPP, exploring its primary drivers and determining its correlation with various climatological, agronomic, and plant status variables. logical, agronomic, and plant status variables.
Conceptual Framework for Ecosystem Flux Scaling
Caption:
Conceptual framework illustrating the upscaling from site-level, high-frequency Eddy Covariance (EC) measurements of ecosystem fluxes (e.g., CH₄, NEE) to regional, state-scale GPP and growing season length maps, leveraging multi-source environmental and agronomic data.
Detailed Description:
Site-Scale Measurement:
Eddy Covariance (EC) sensors collect high-frequency (20 Hz) ground-truth data on gas exchange, specifically methane (CH₄) flux and Net Ecosystem Exchange (NEE), directly above flooded agricultural systems.Environmental Drivers:
Flooding and elevated soil temperatures create anaerobic soil conditions that promote methanogen activity, generating methane flux detected by the EC system.- Predictor Integration:
The model incorporates three categories of predictors from satellite and gridded environmental data:- Climatological (Temperature, Precipitation)
- Plant Status (EVI, NDVI)
- Water status Status (LSWI)
- Agronomic (Cultivar, Planting Date)
to capture complex site-scale relationships.
- Model Output:
Predictor variables are integrated into state-scale predictive models, scaling site-level measurements to generate maps of planting dates, GPP, and CH4 flux.
Conceptual Figure: Vegetation Phenological Stages
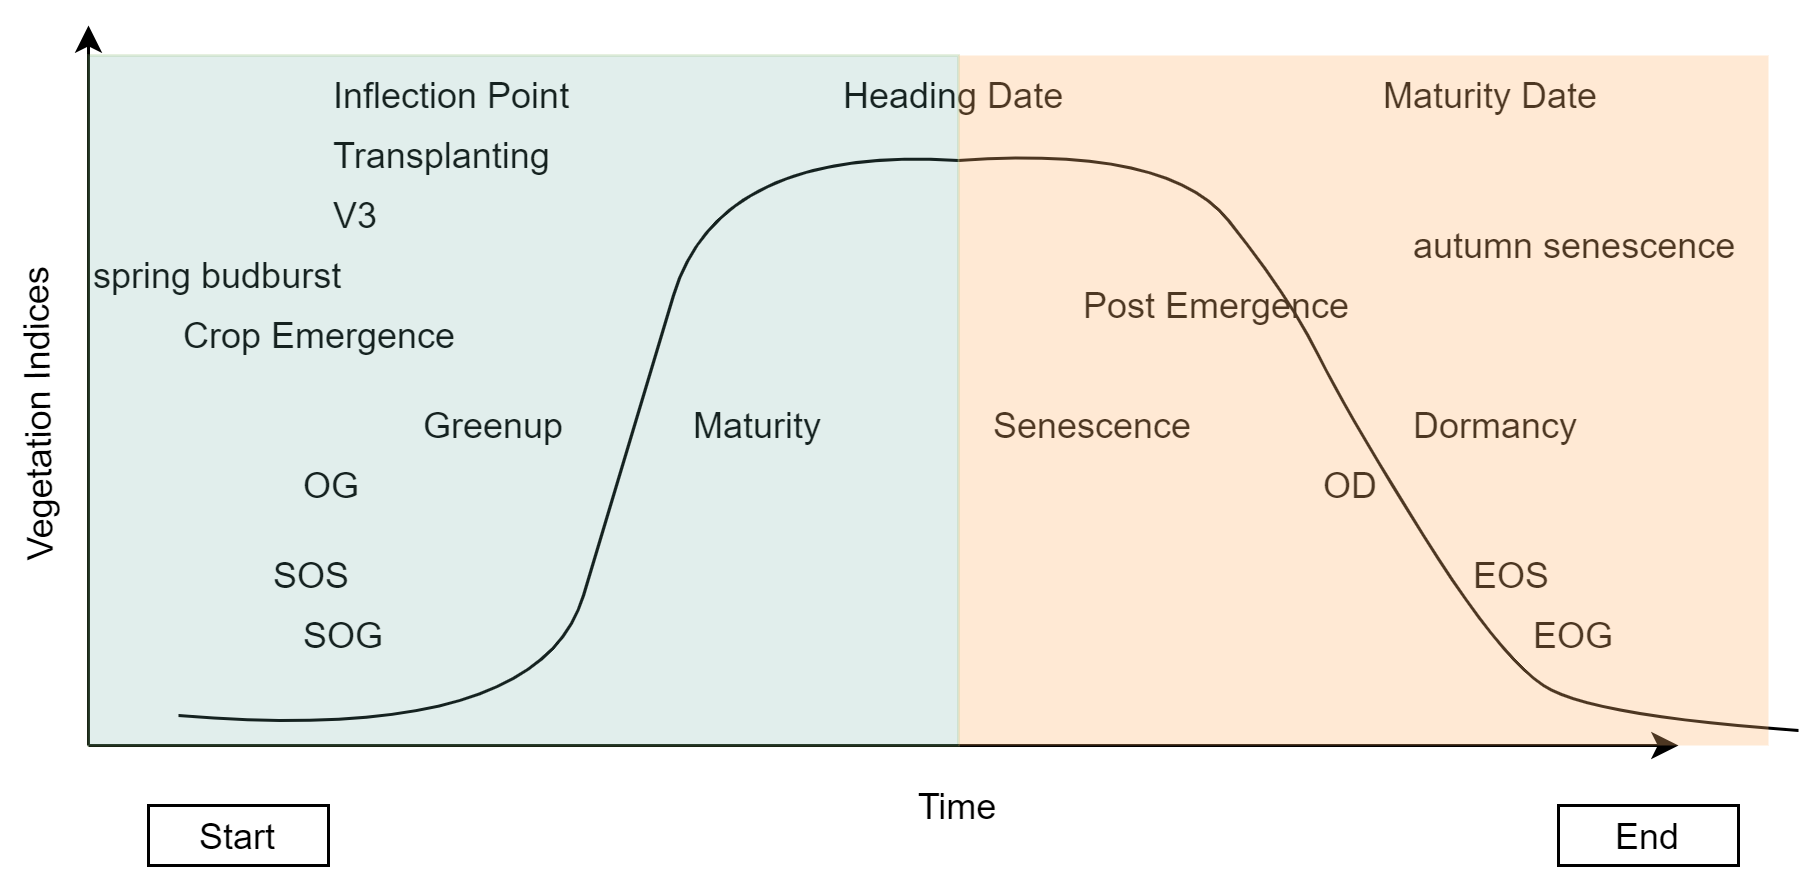
Figure Description:
The figure illustrates different terminologies used to describe vegetation phenology and how these stages align along the plant growth curve throughout the growing season. The curve represents the general pattern of plant development, from emergence or green-up to maturity and senescence, typically observed in a single cropping system (this curve does not hold true for double-cropping systems).
Key phenological stages—such as Start of Season (SOS), Green-Up Date (GUD), Peak of Season (POS), and End of Season (EOS)—mark transitions in vegetation activity and help visualize how plant growth progresses through time.