Maps
Here are some maps and visualizations:
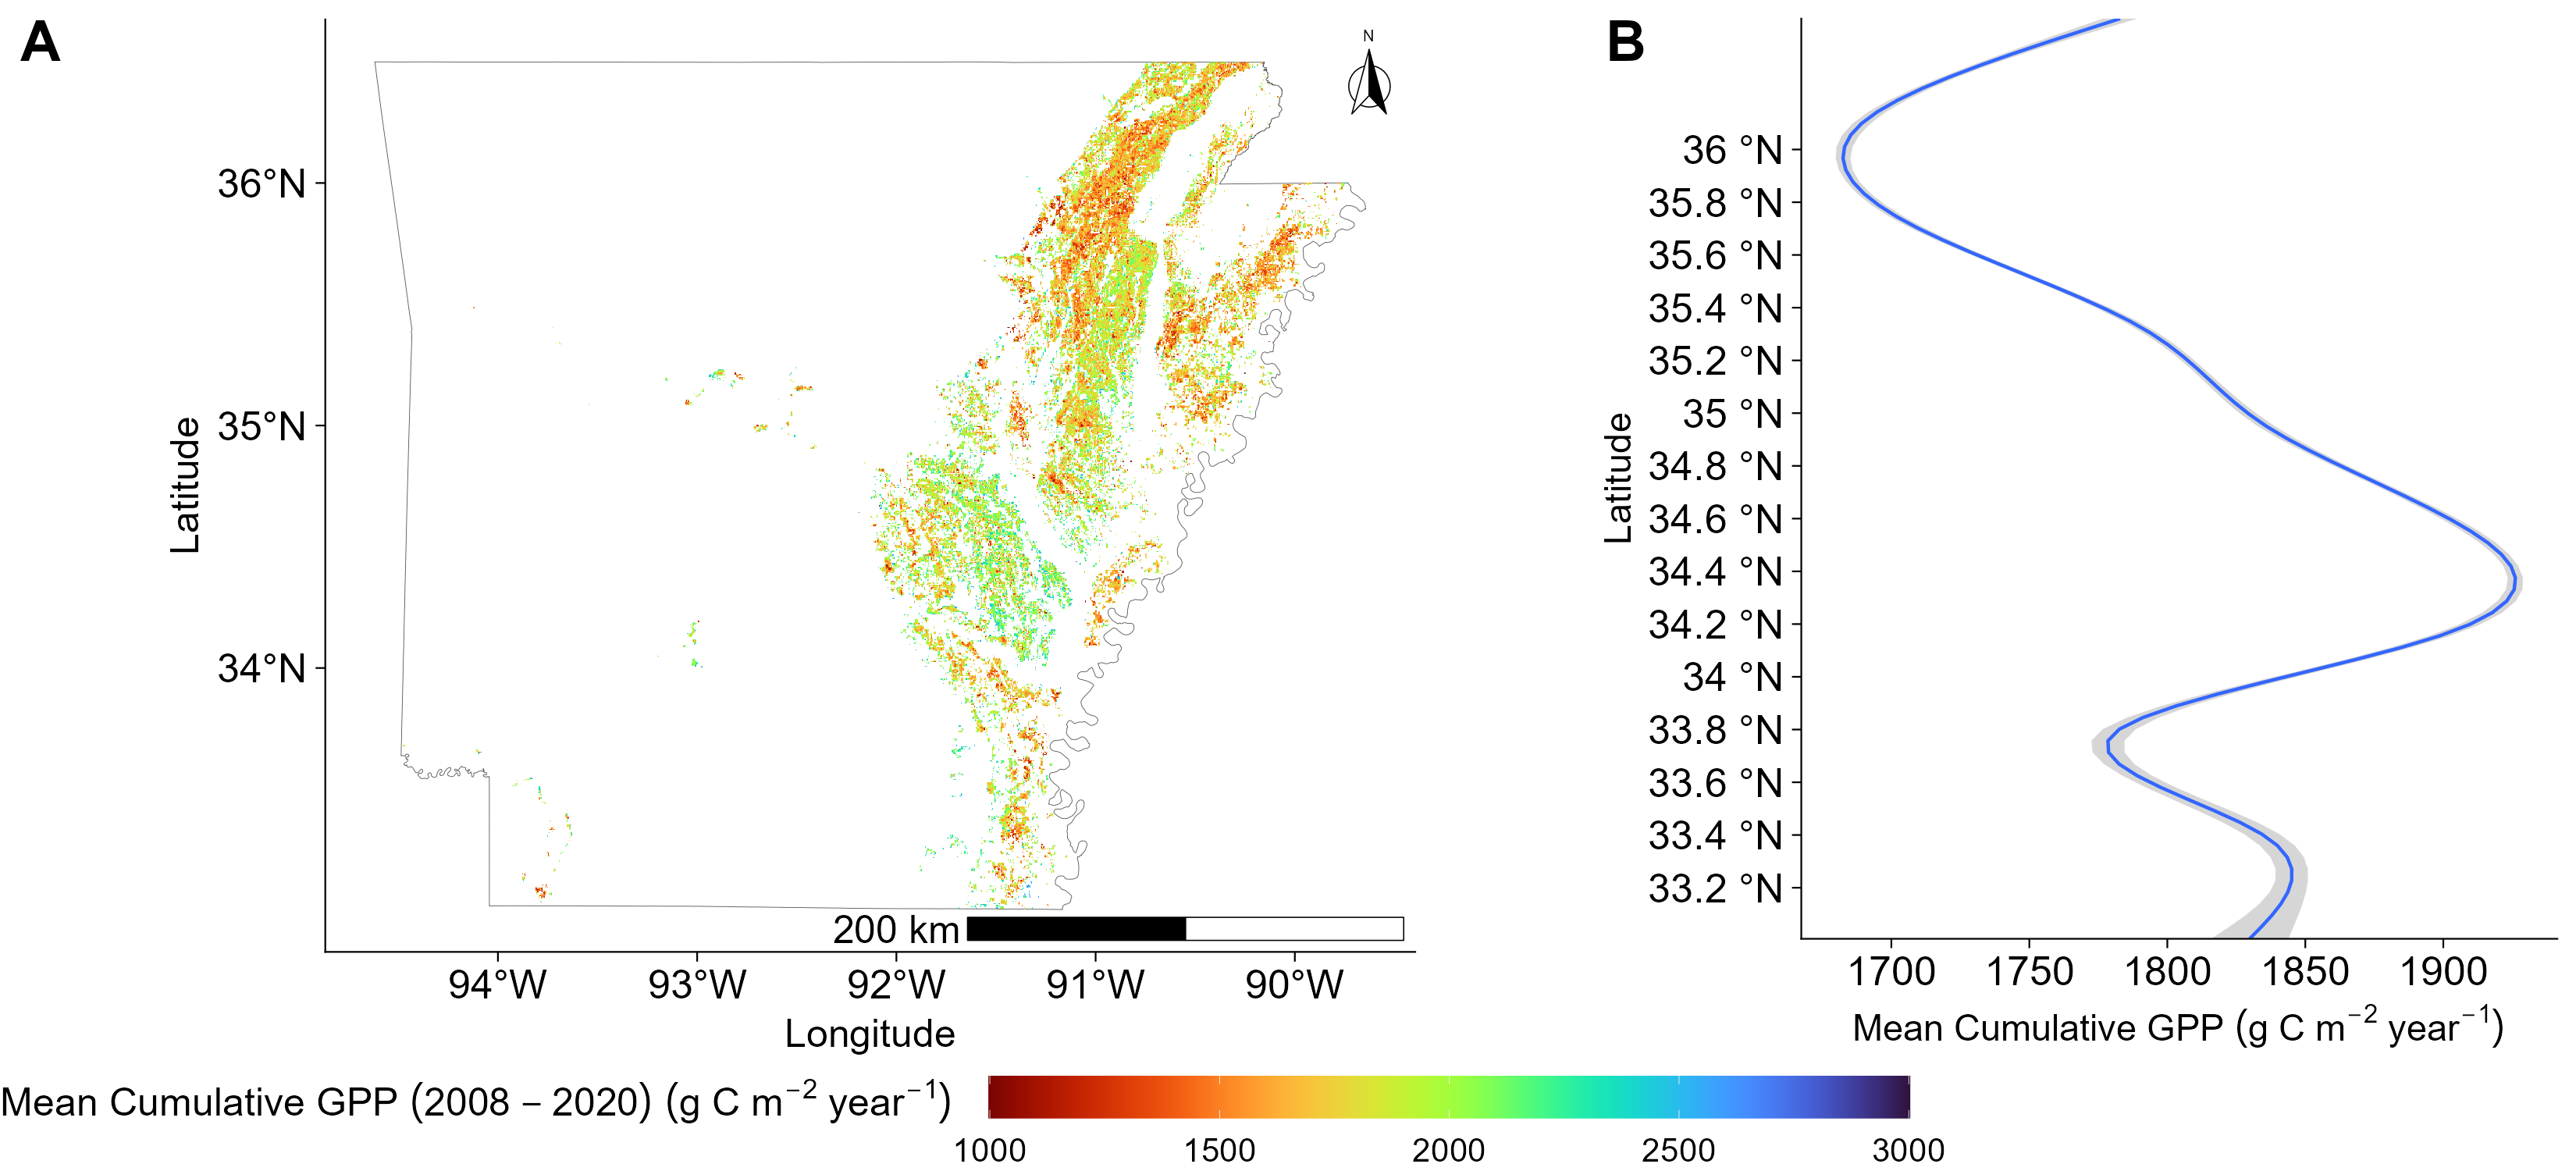
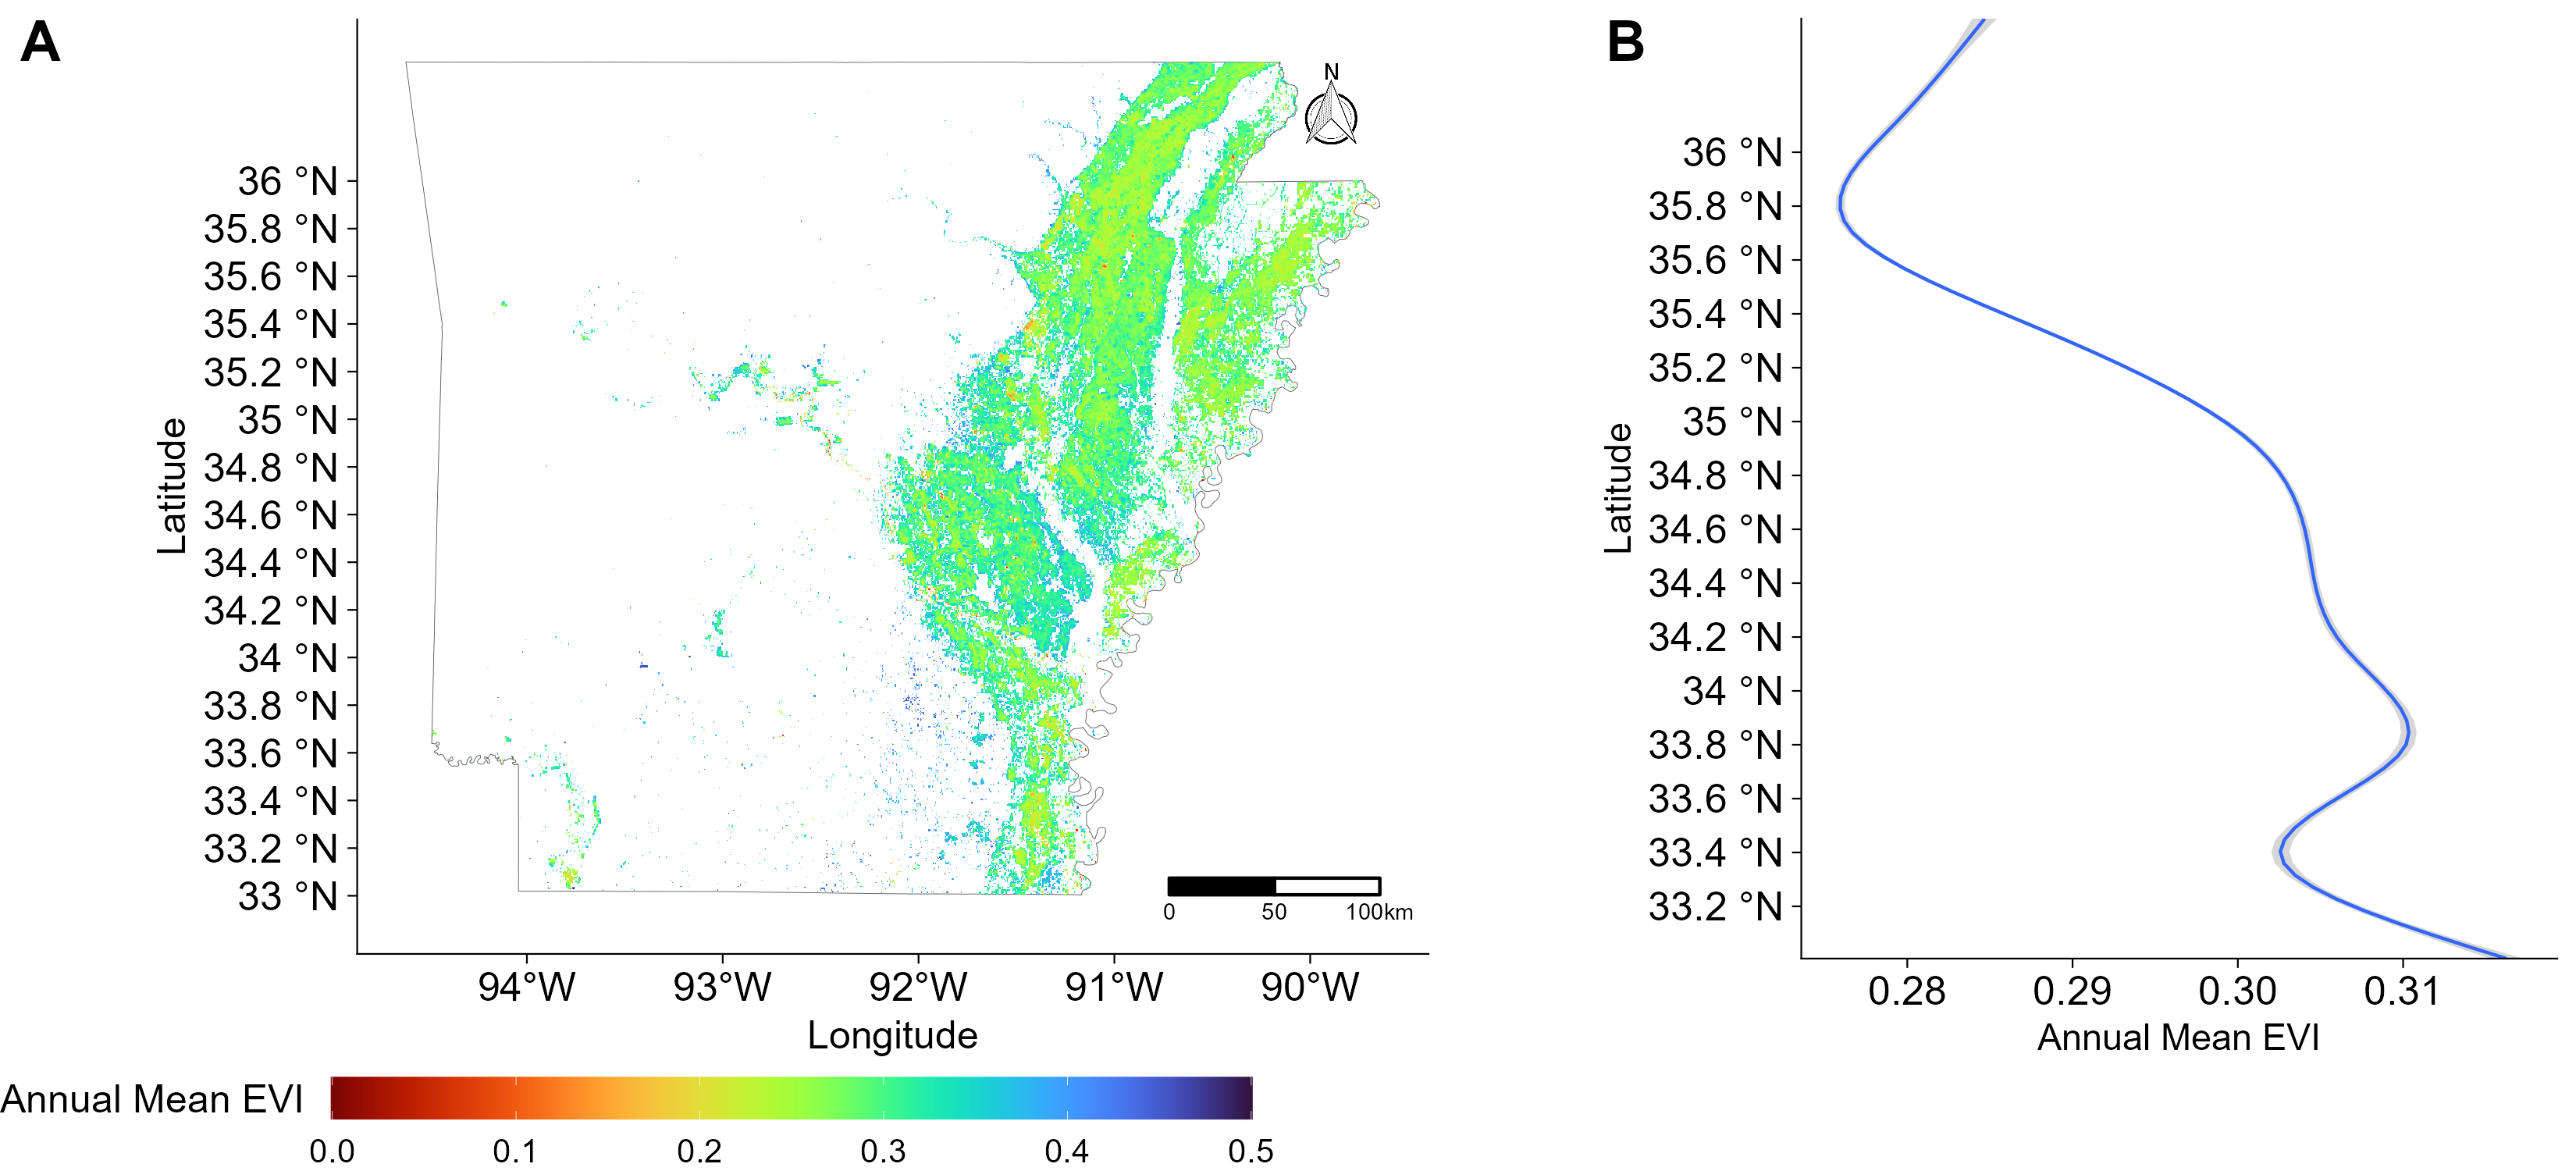
How rice plant photosynthesis varies across different parts of Arkansas
Spatial profile of photosynthesis across the state from a mathematical model, at 500-m resolution. (A) Map of the mean (across years) cumulative (within year) photosynthesis (2008–2020) of the rice layer in Arkansas. (B) Mean latitudinal distribution of photosynthesis (2008–2020)
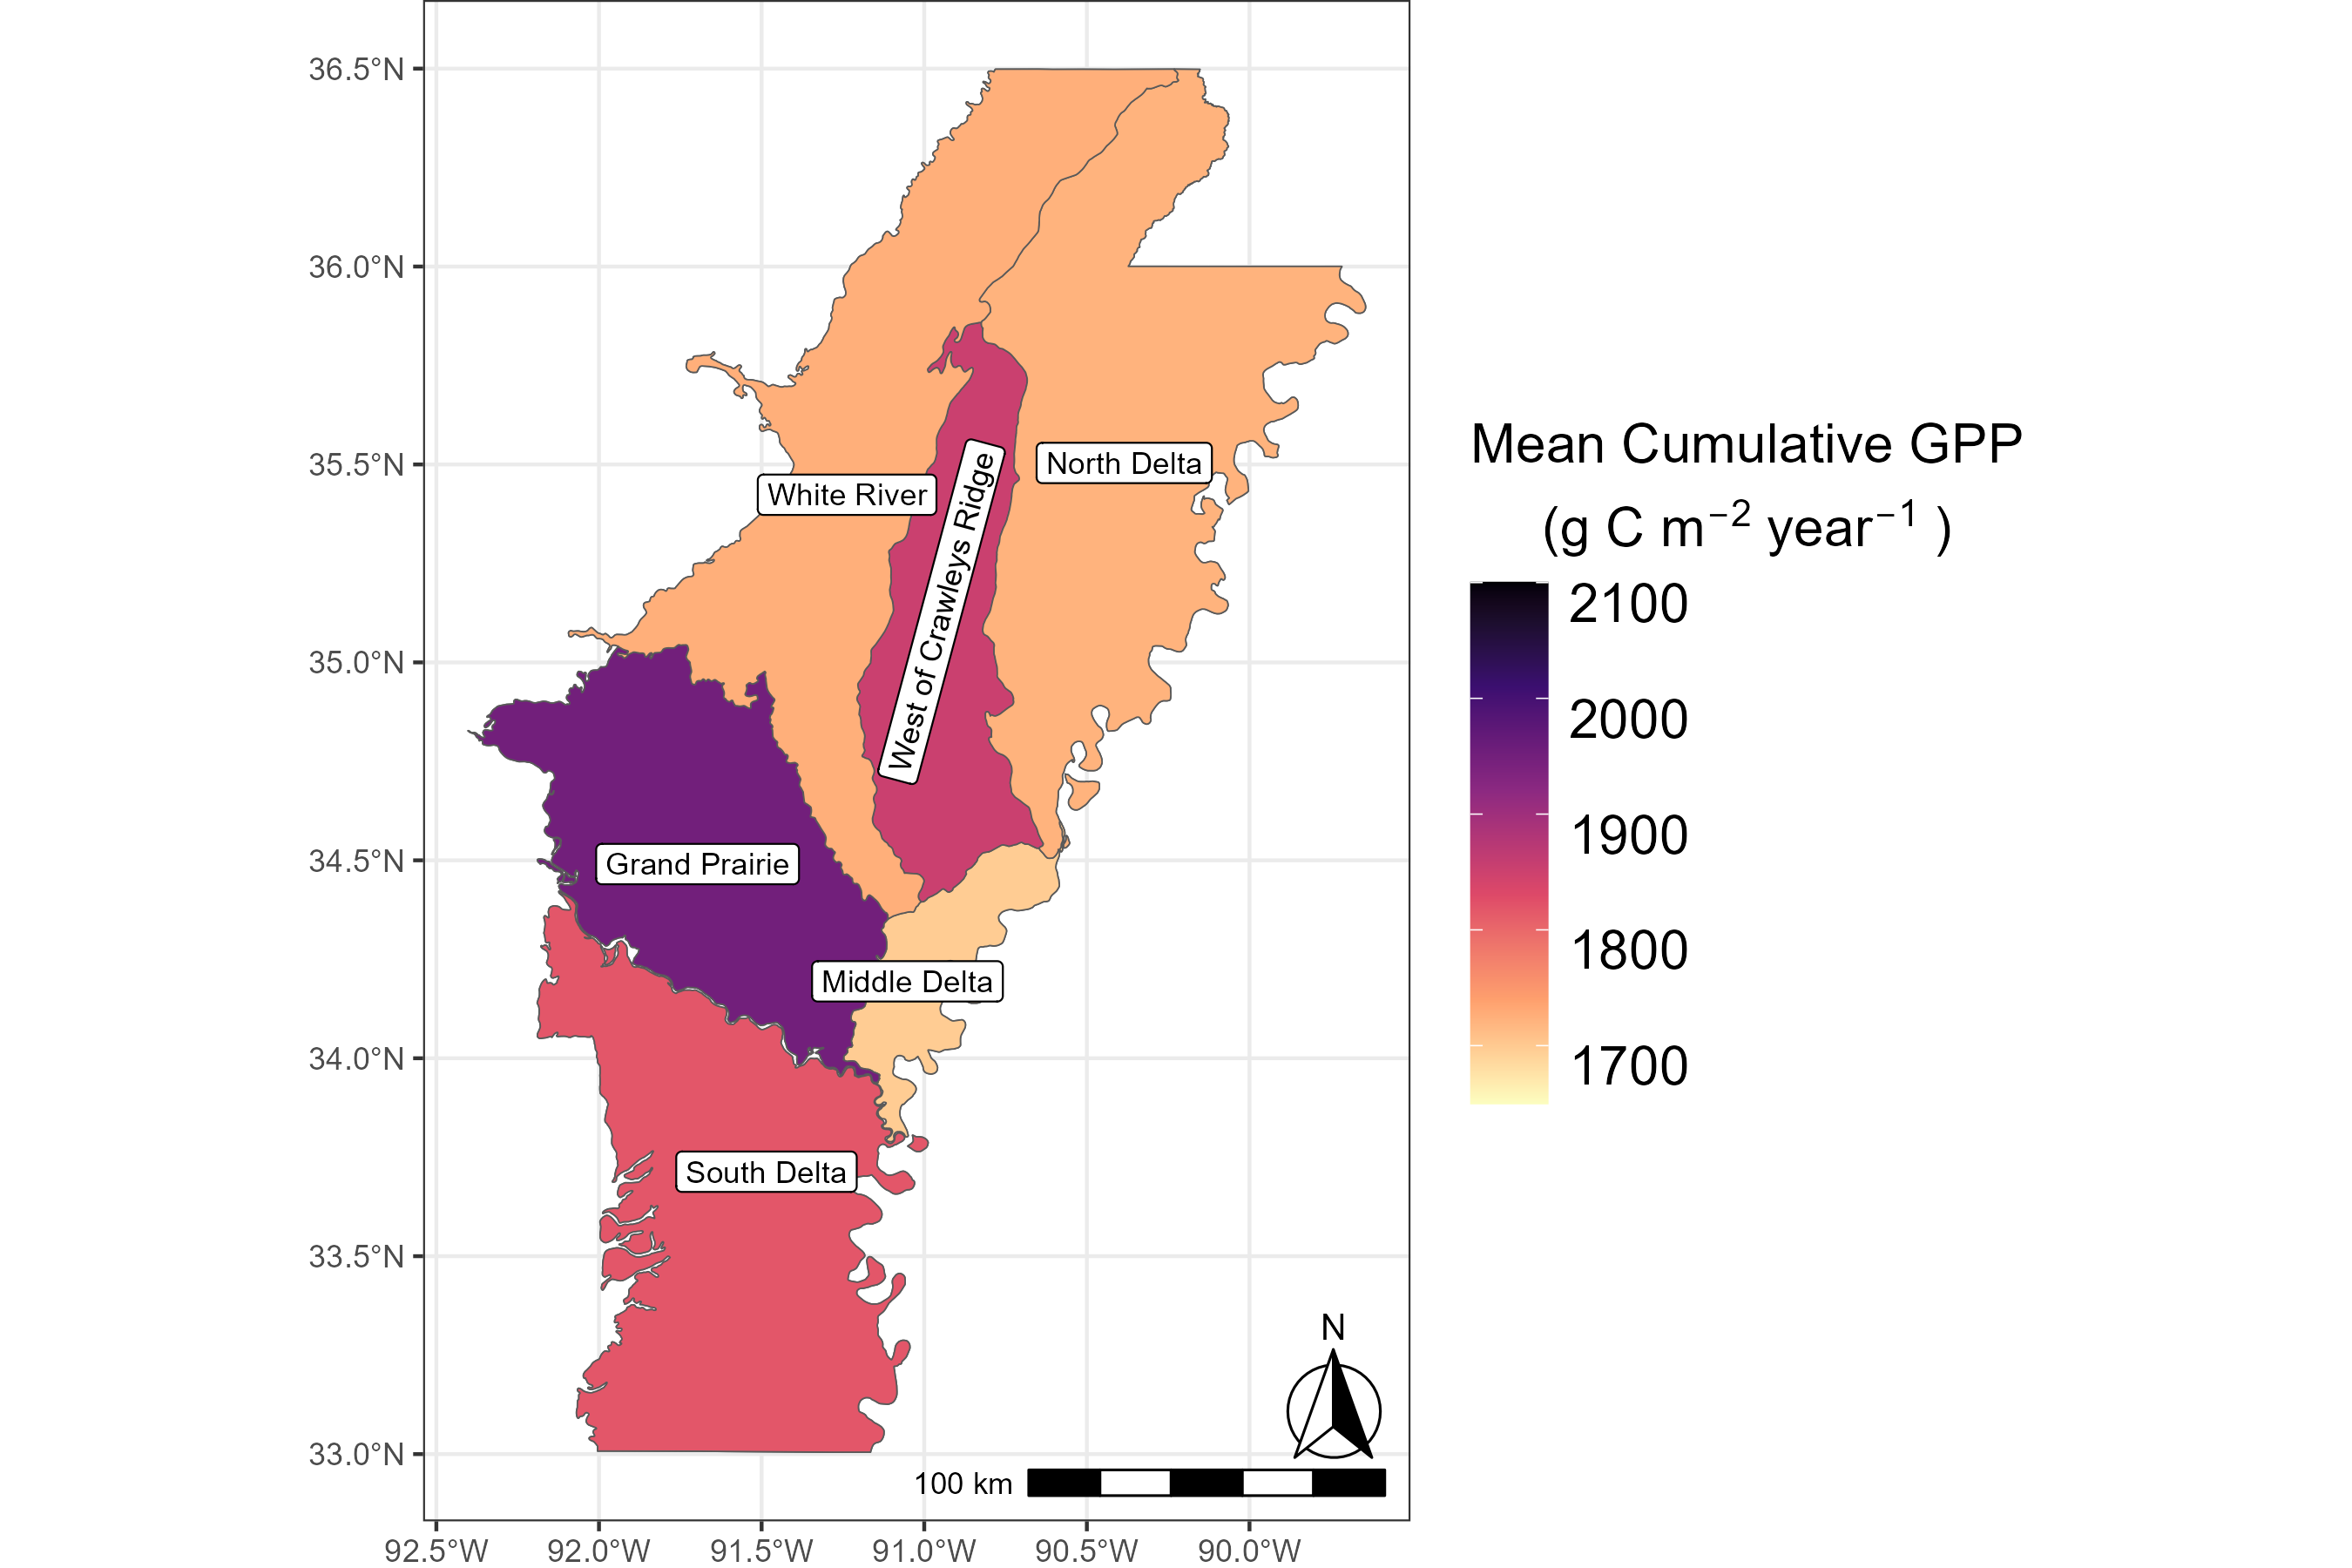
Comparing how much rice phosynthesizes in different rice-farming areas of Arkansas
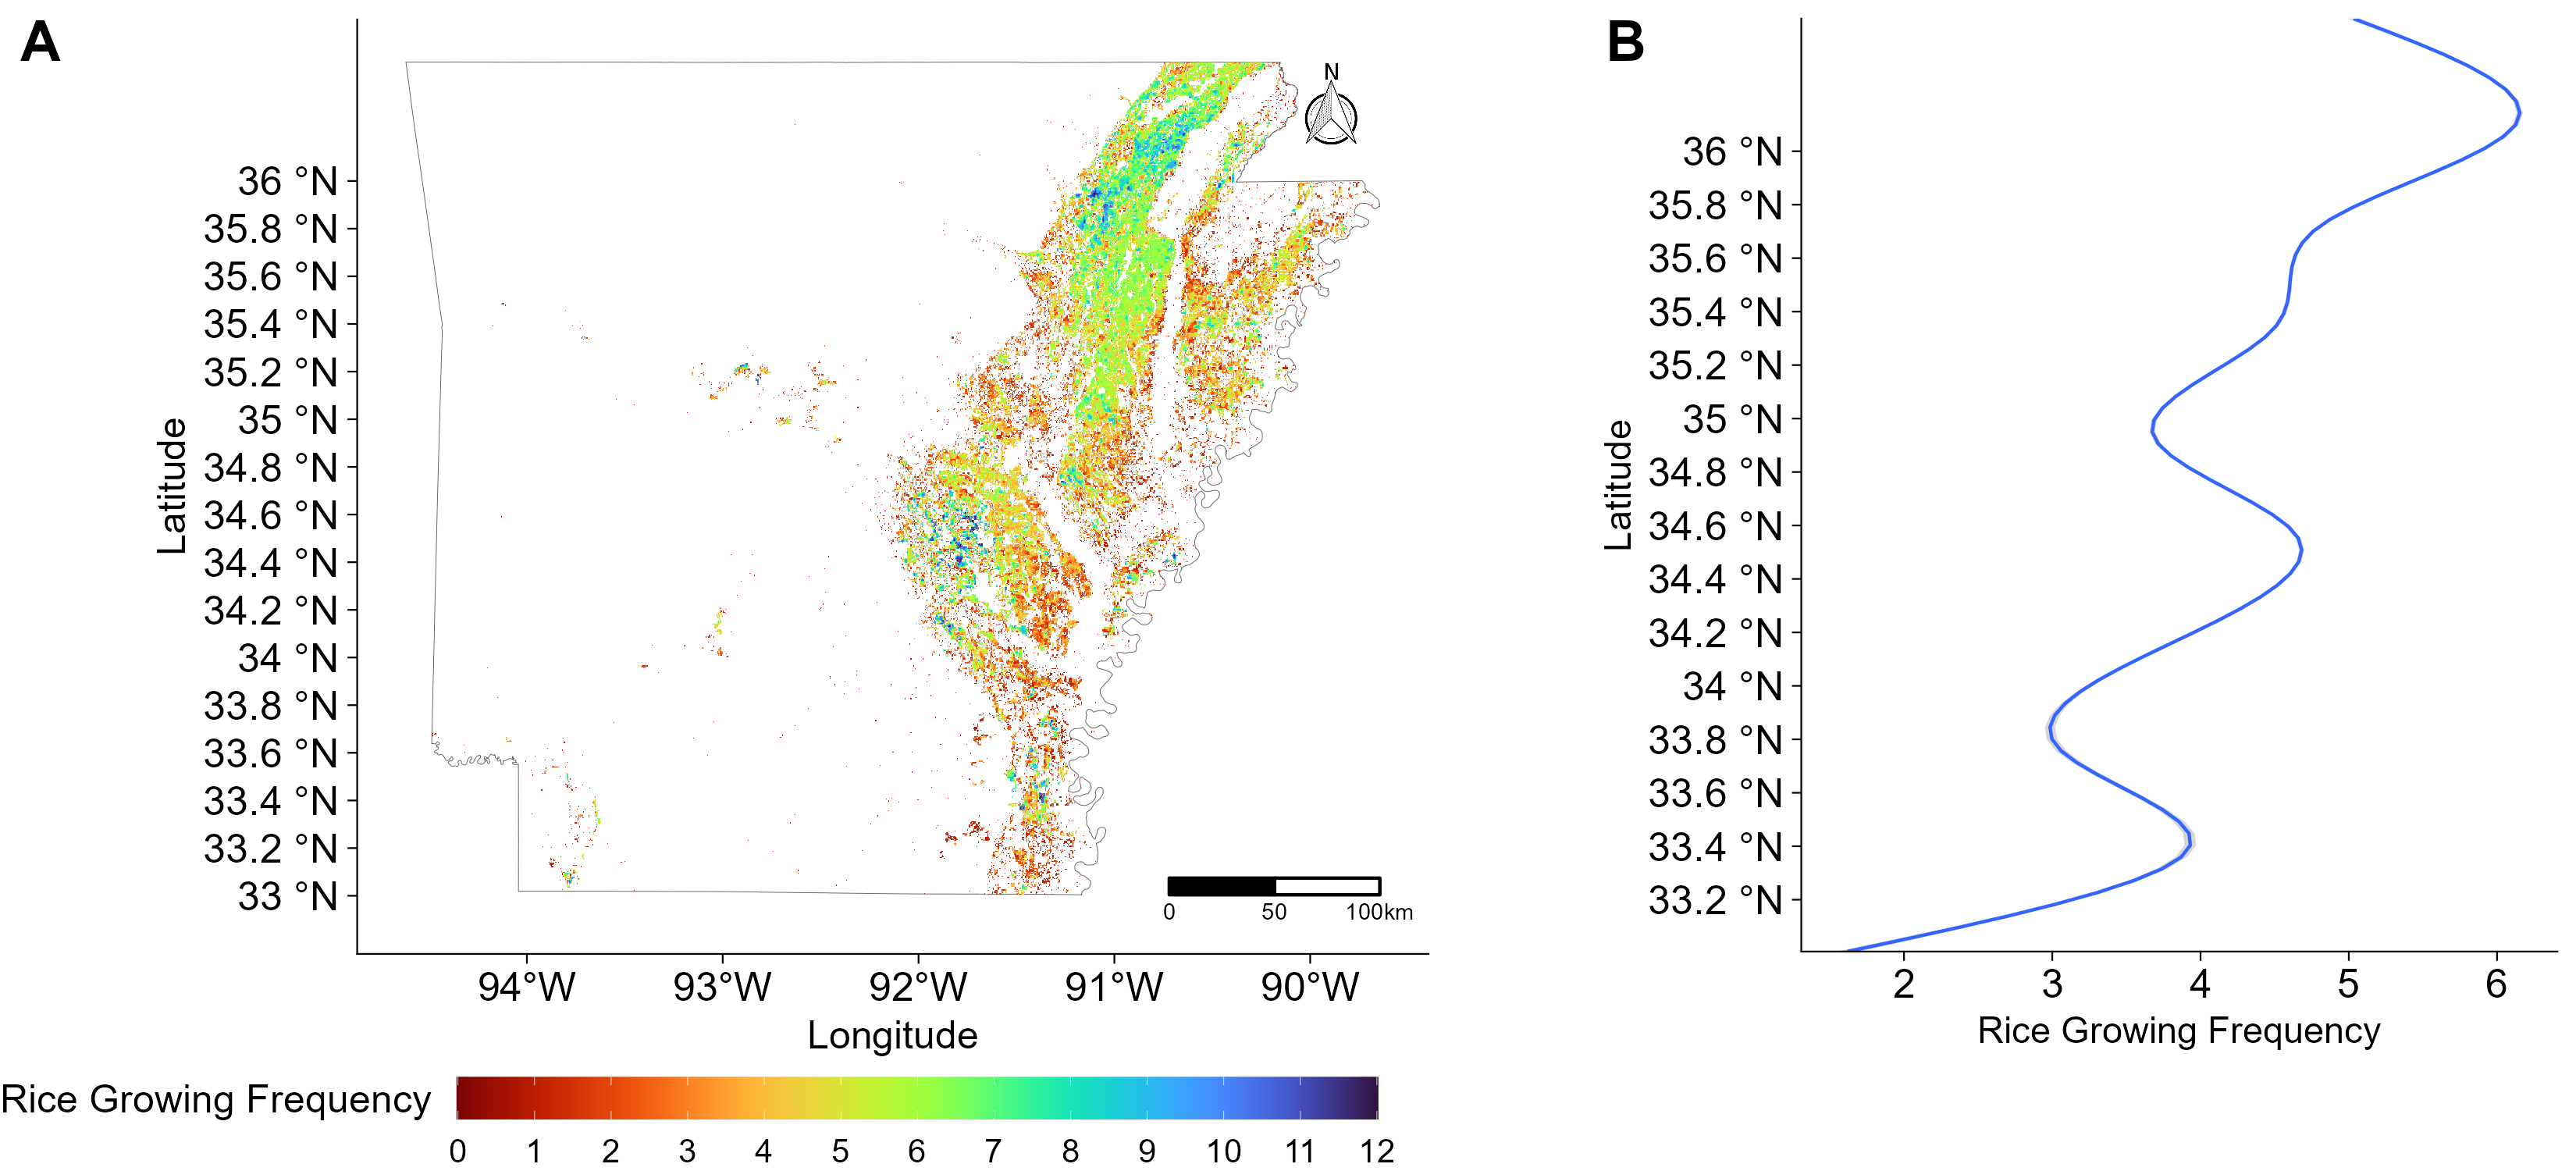
How often rice was grown in Arkansas fields from 2008 to 2020
Satellite-based map showing how green the rice plants are in different areas, using a vegetation index called EVI
GPP and Yield Correlation and Significance Map

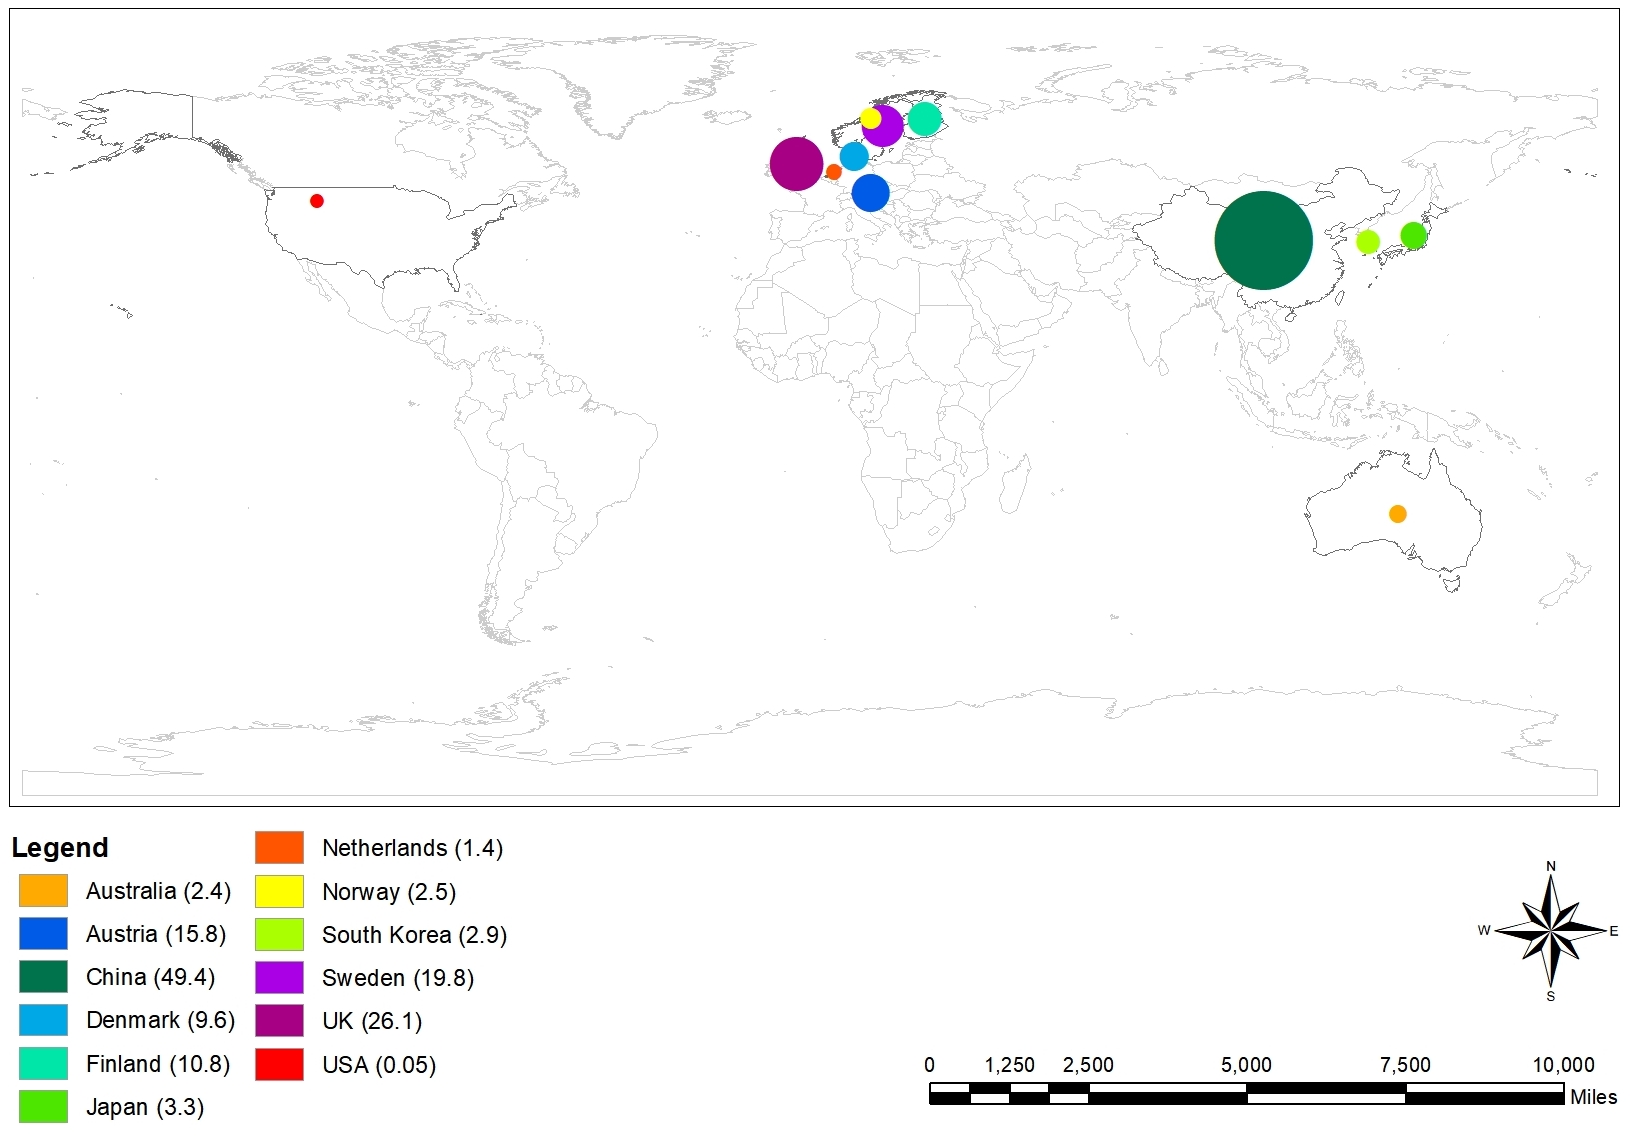
Global Substitutability of Recovered Phosphorus by Country
A global overview of the potential to replace conventional phosphorus with phosphorus recovered from the waste sector, illustrated using decoupling factors (values are indicated in parentheses for each country).
This figure is published in a peer-reviewed scientific article and can be accessed at:
https://doi.org/10.1016/j.resconrec.2019.01.022
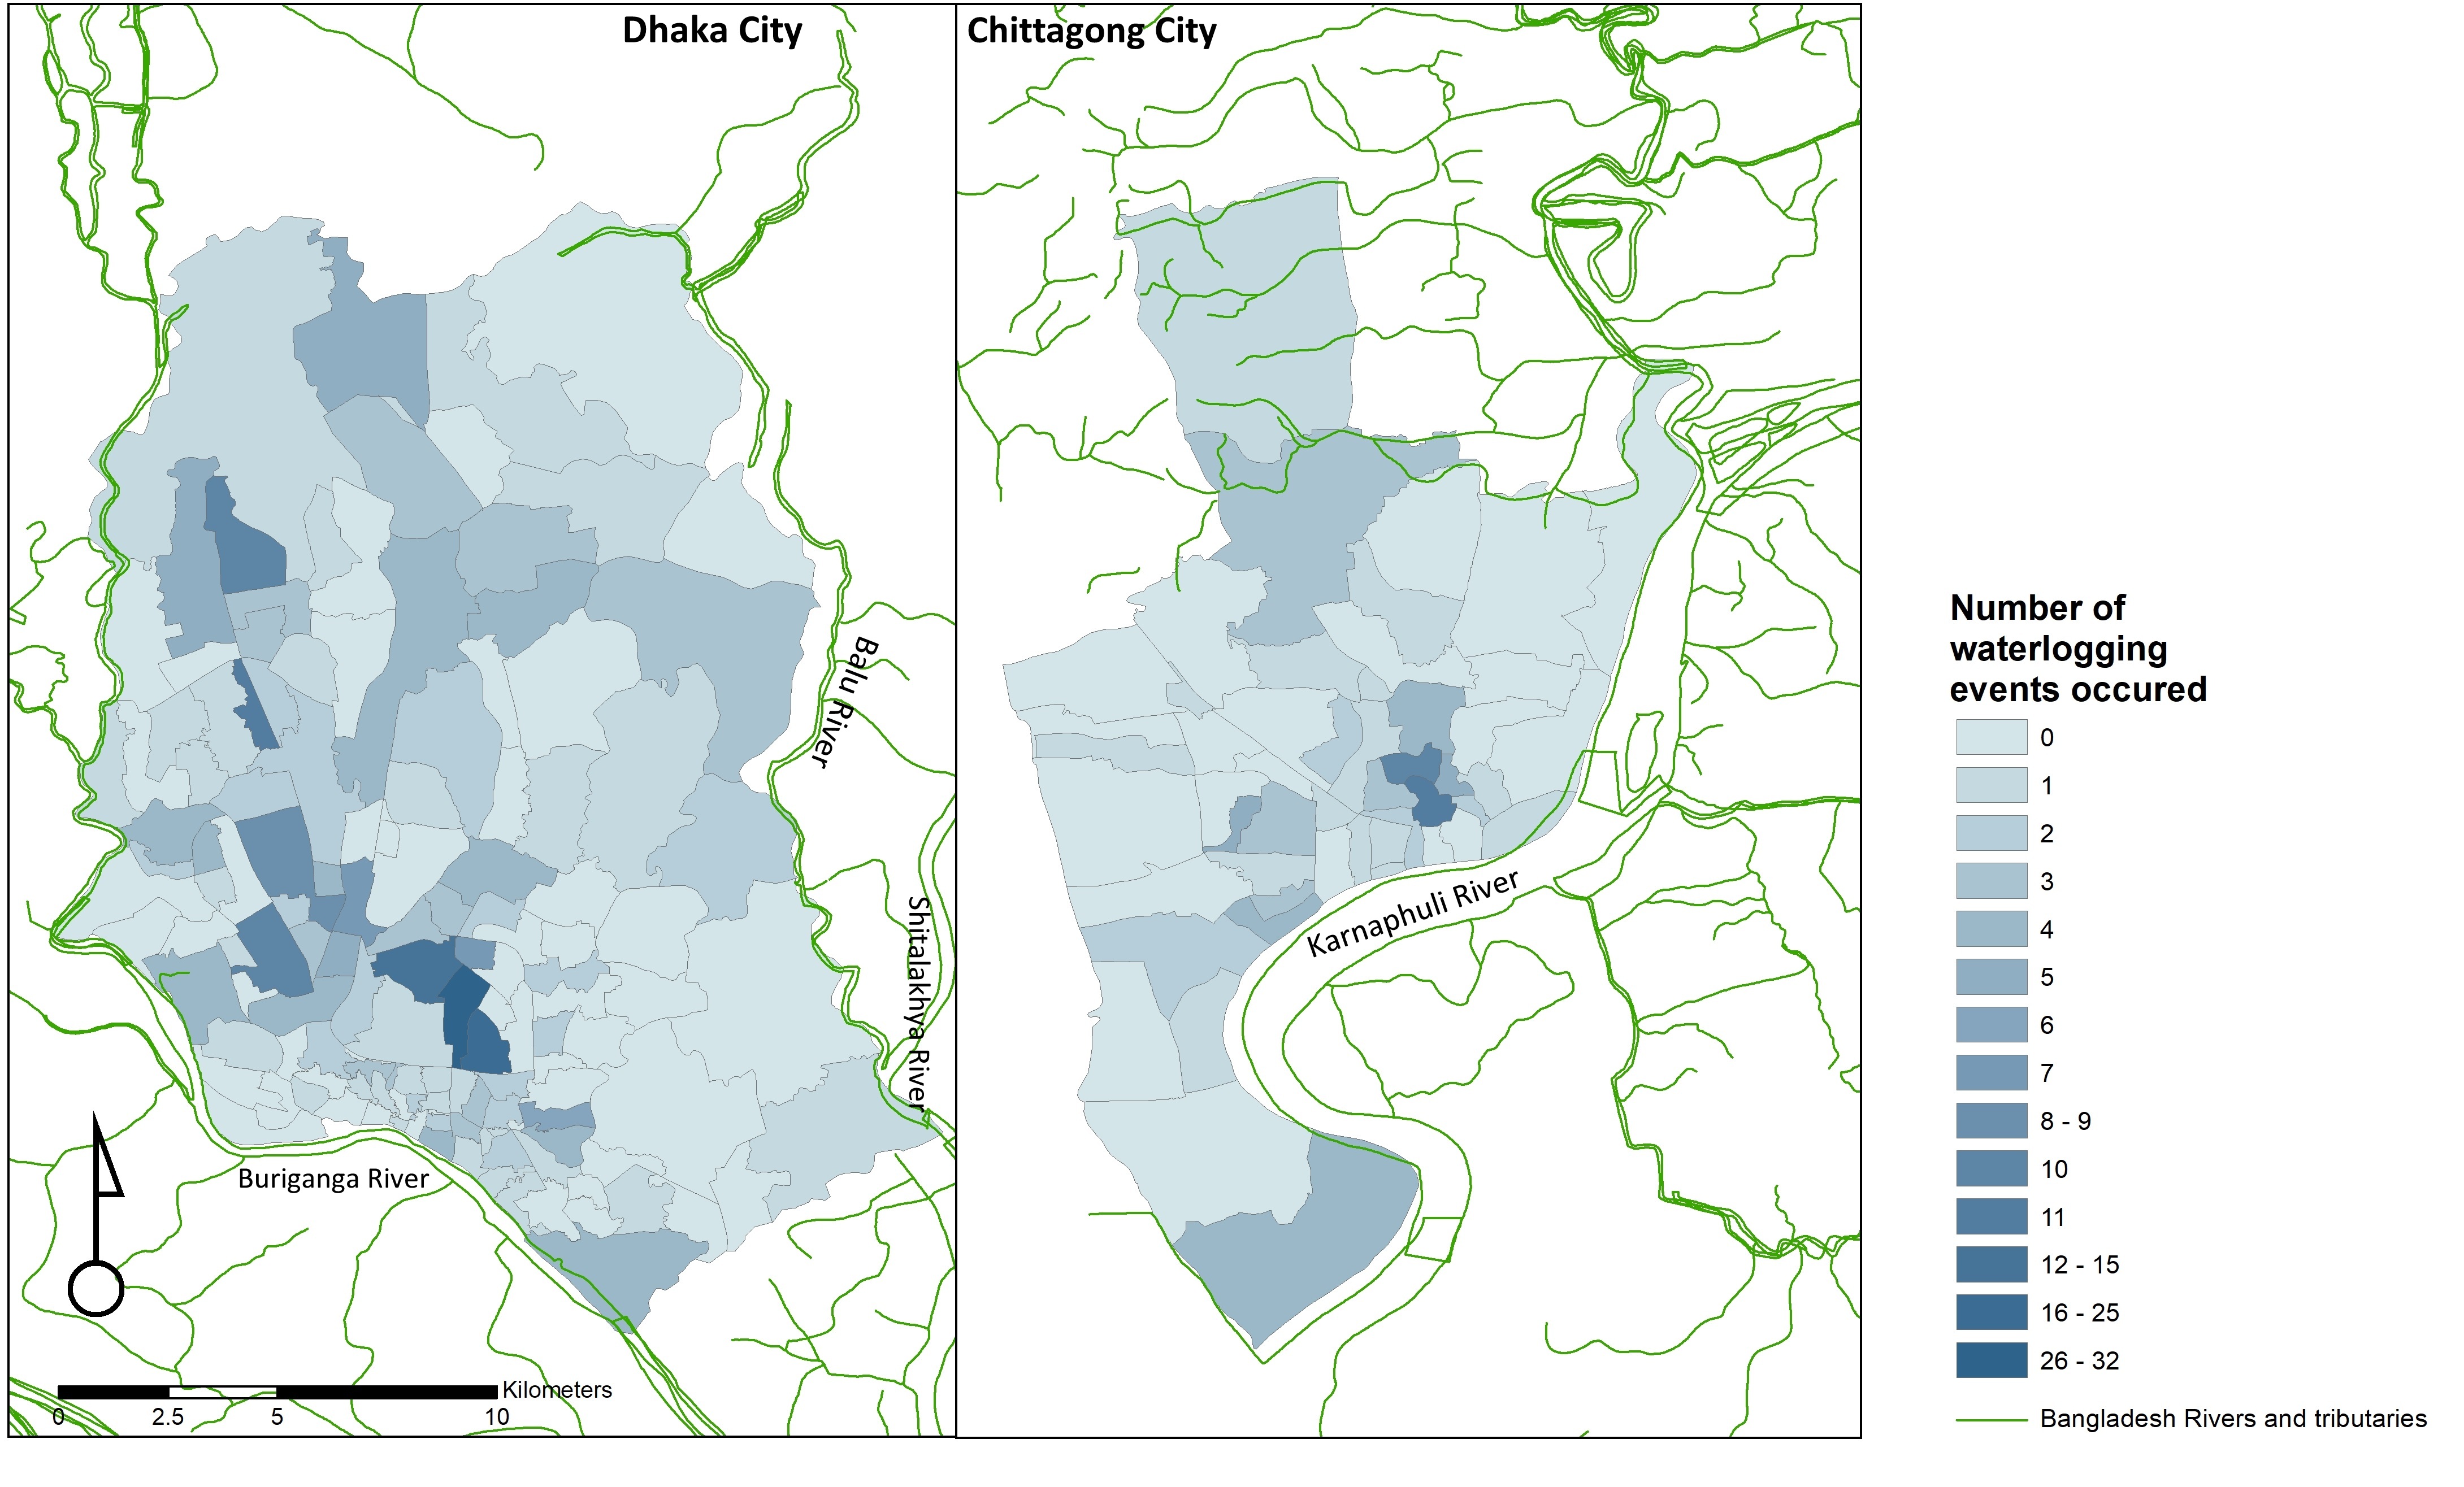
Map showing how many waterlogging incidents were reported in newspapers for each council area in Dhaka and Chittagong the two largest cities in Bangladesh
Time series graph showing past and predicted future Human Appropriation of Net Primary Production (HANPP) in each district of Bangladesh. HANPP measures how much of the Earth’s natural resources are used or affected by people
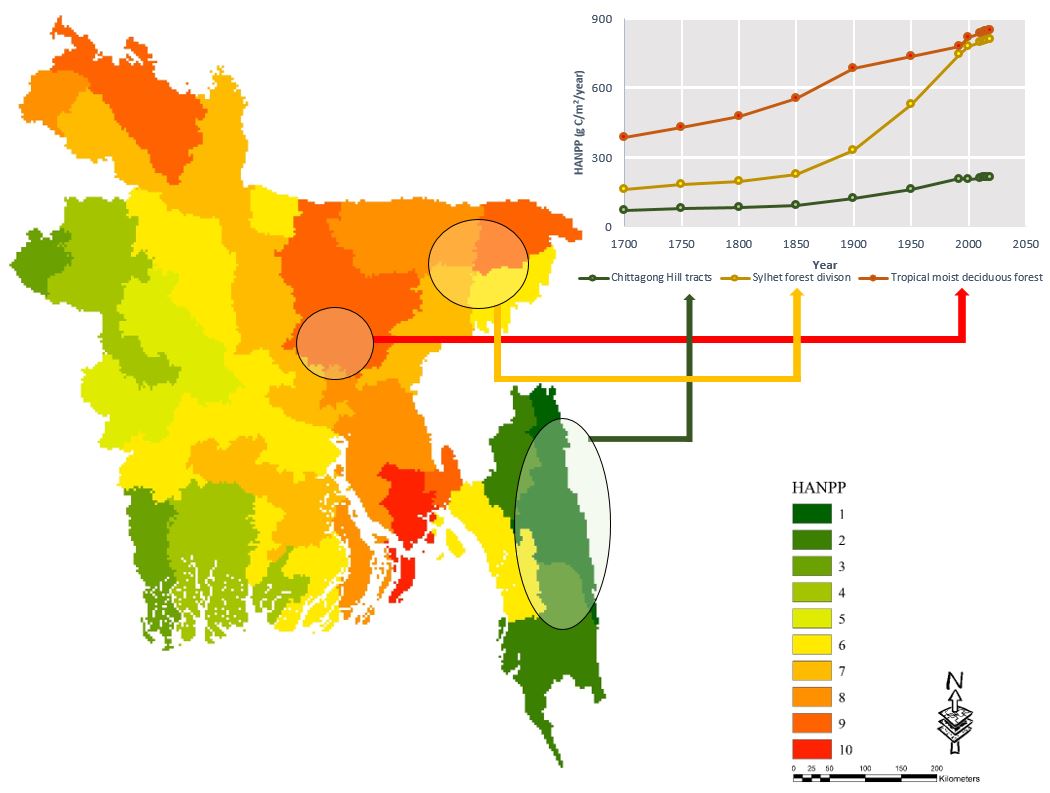
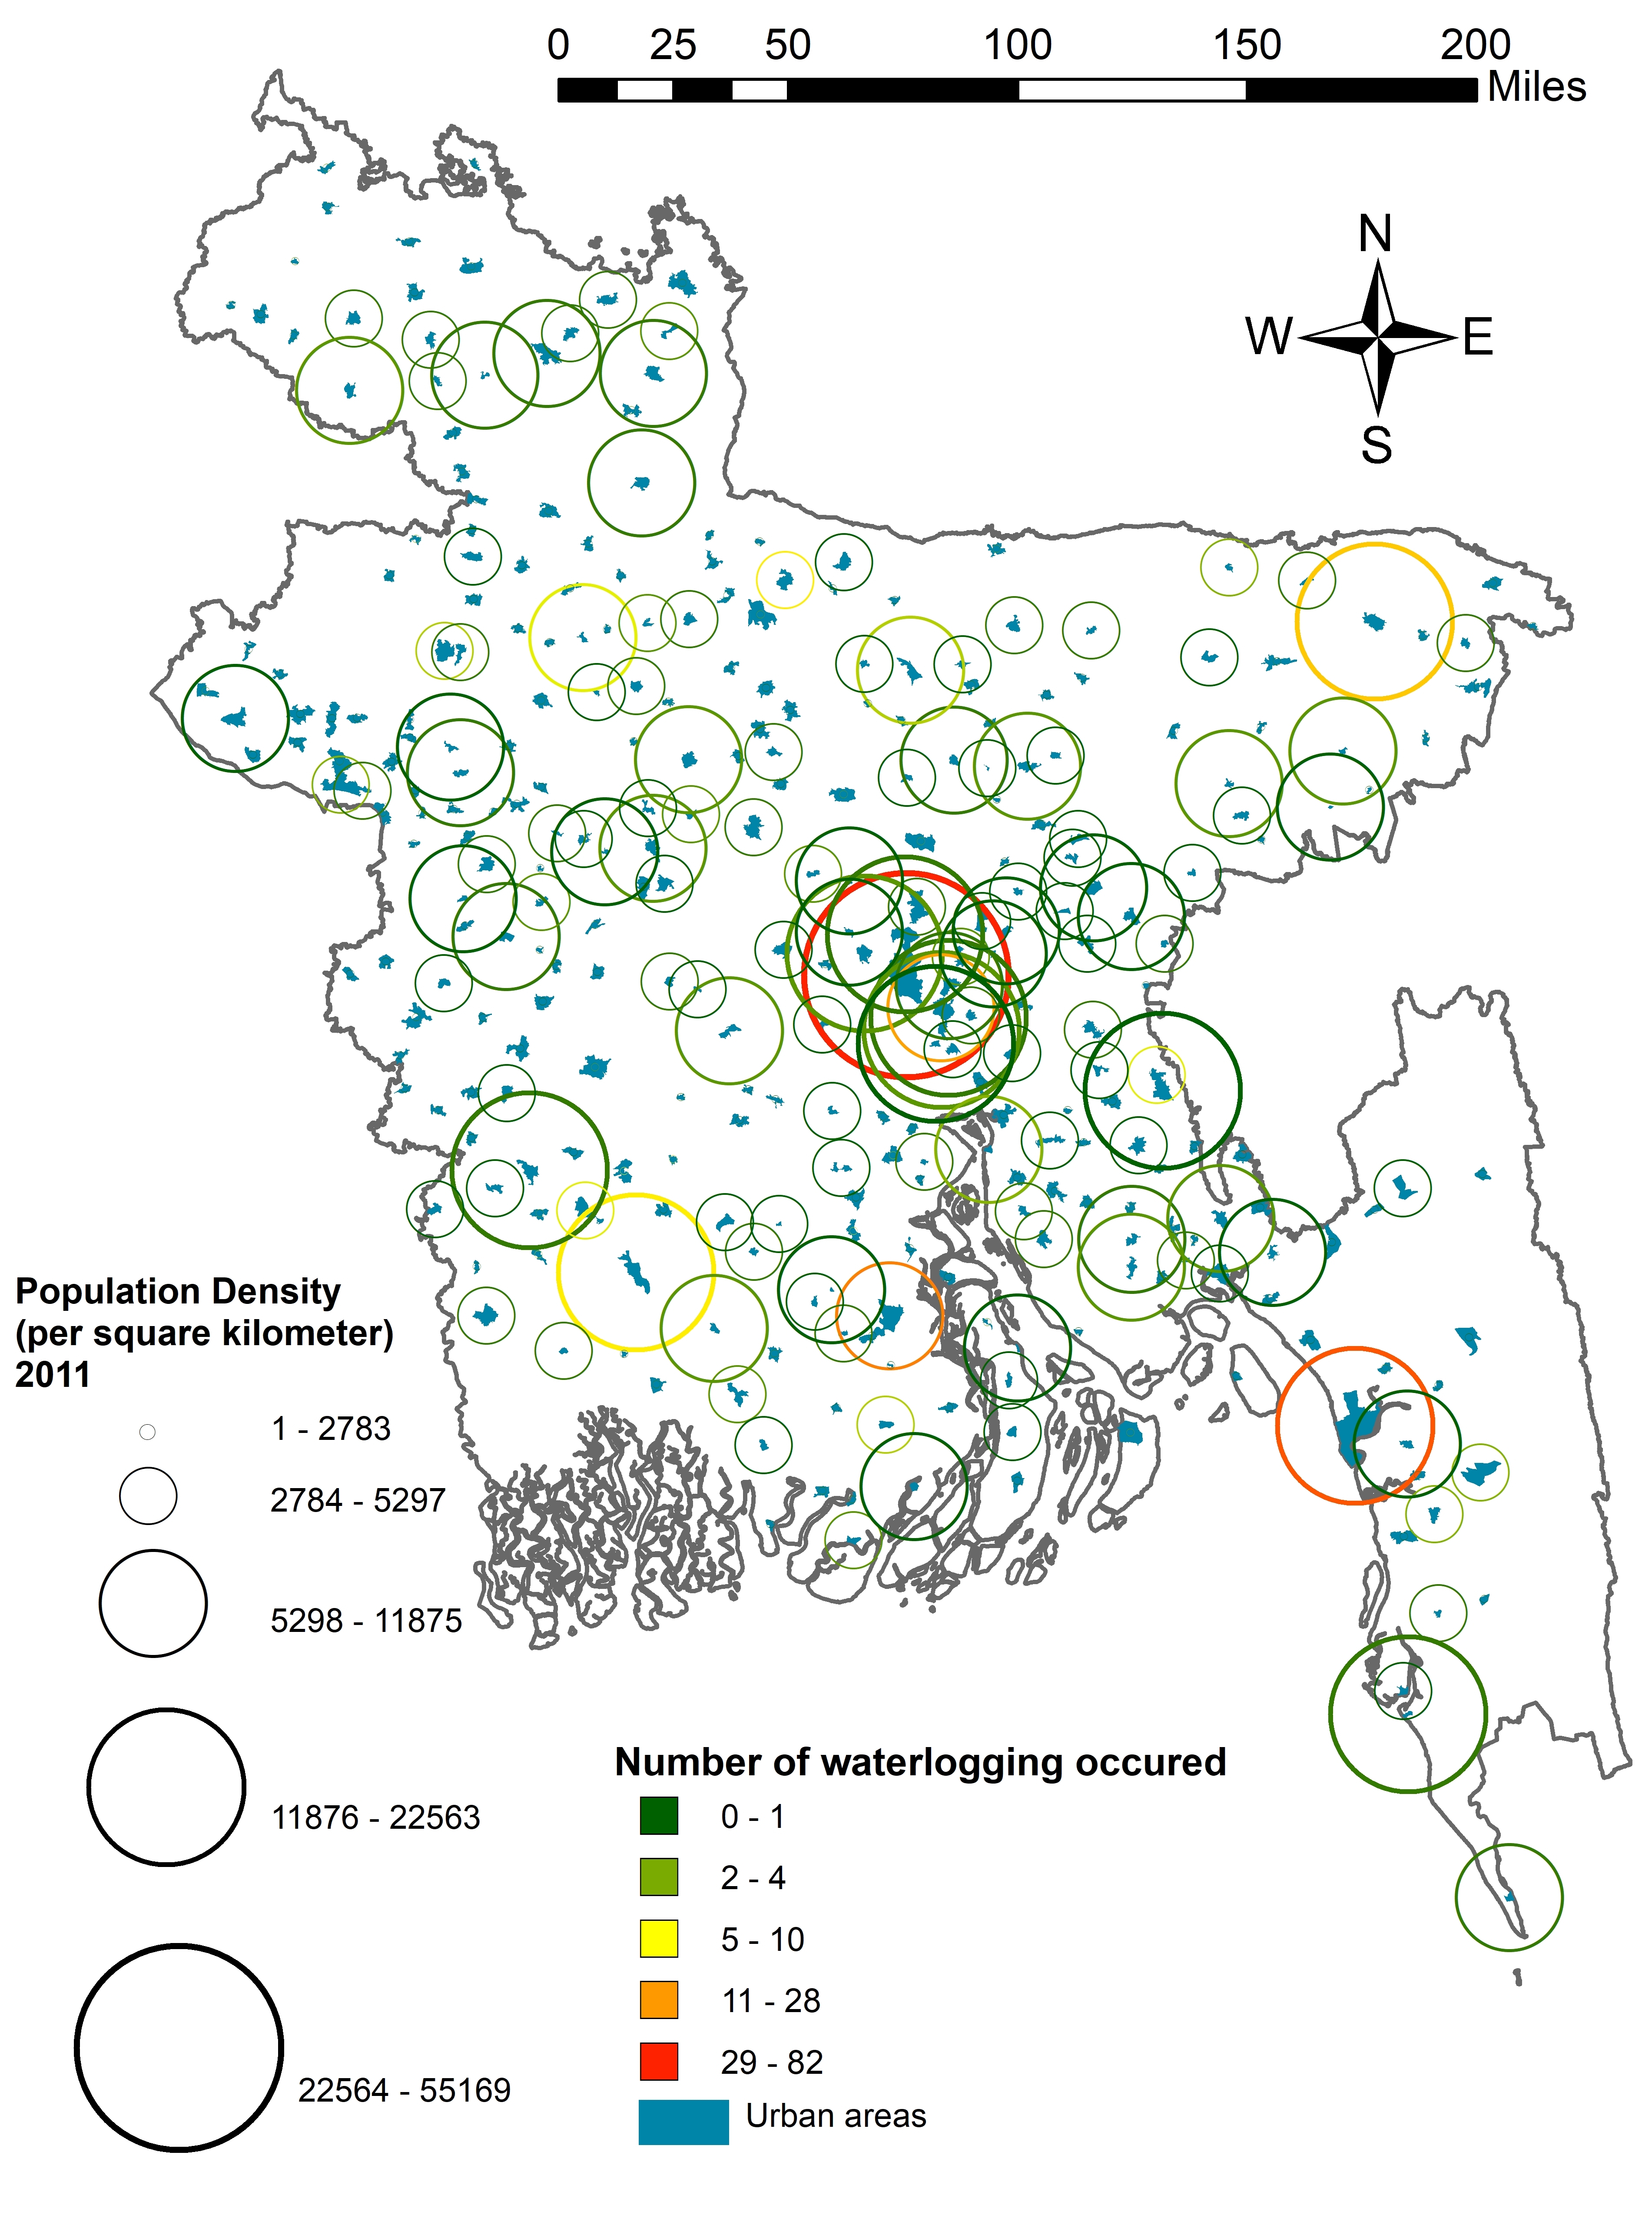
Figure 3
Depicting how population growth (circle size) relates to waterlogging events (circle color) across Bangladesh between 2001 and 2011. Blue-bordered areas represent urban regions
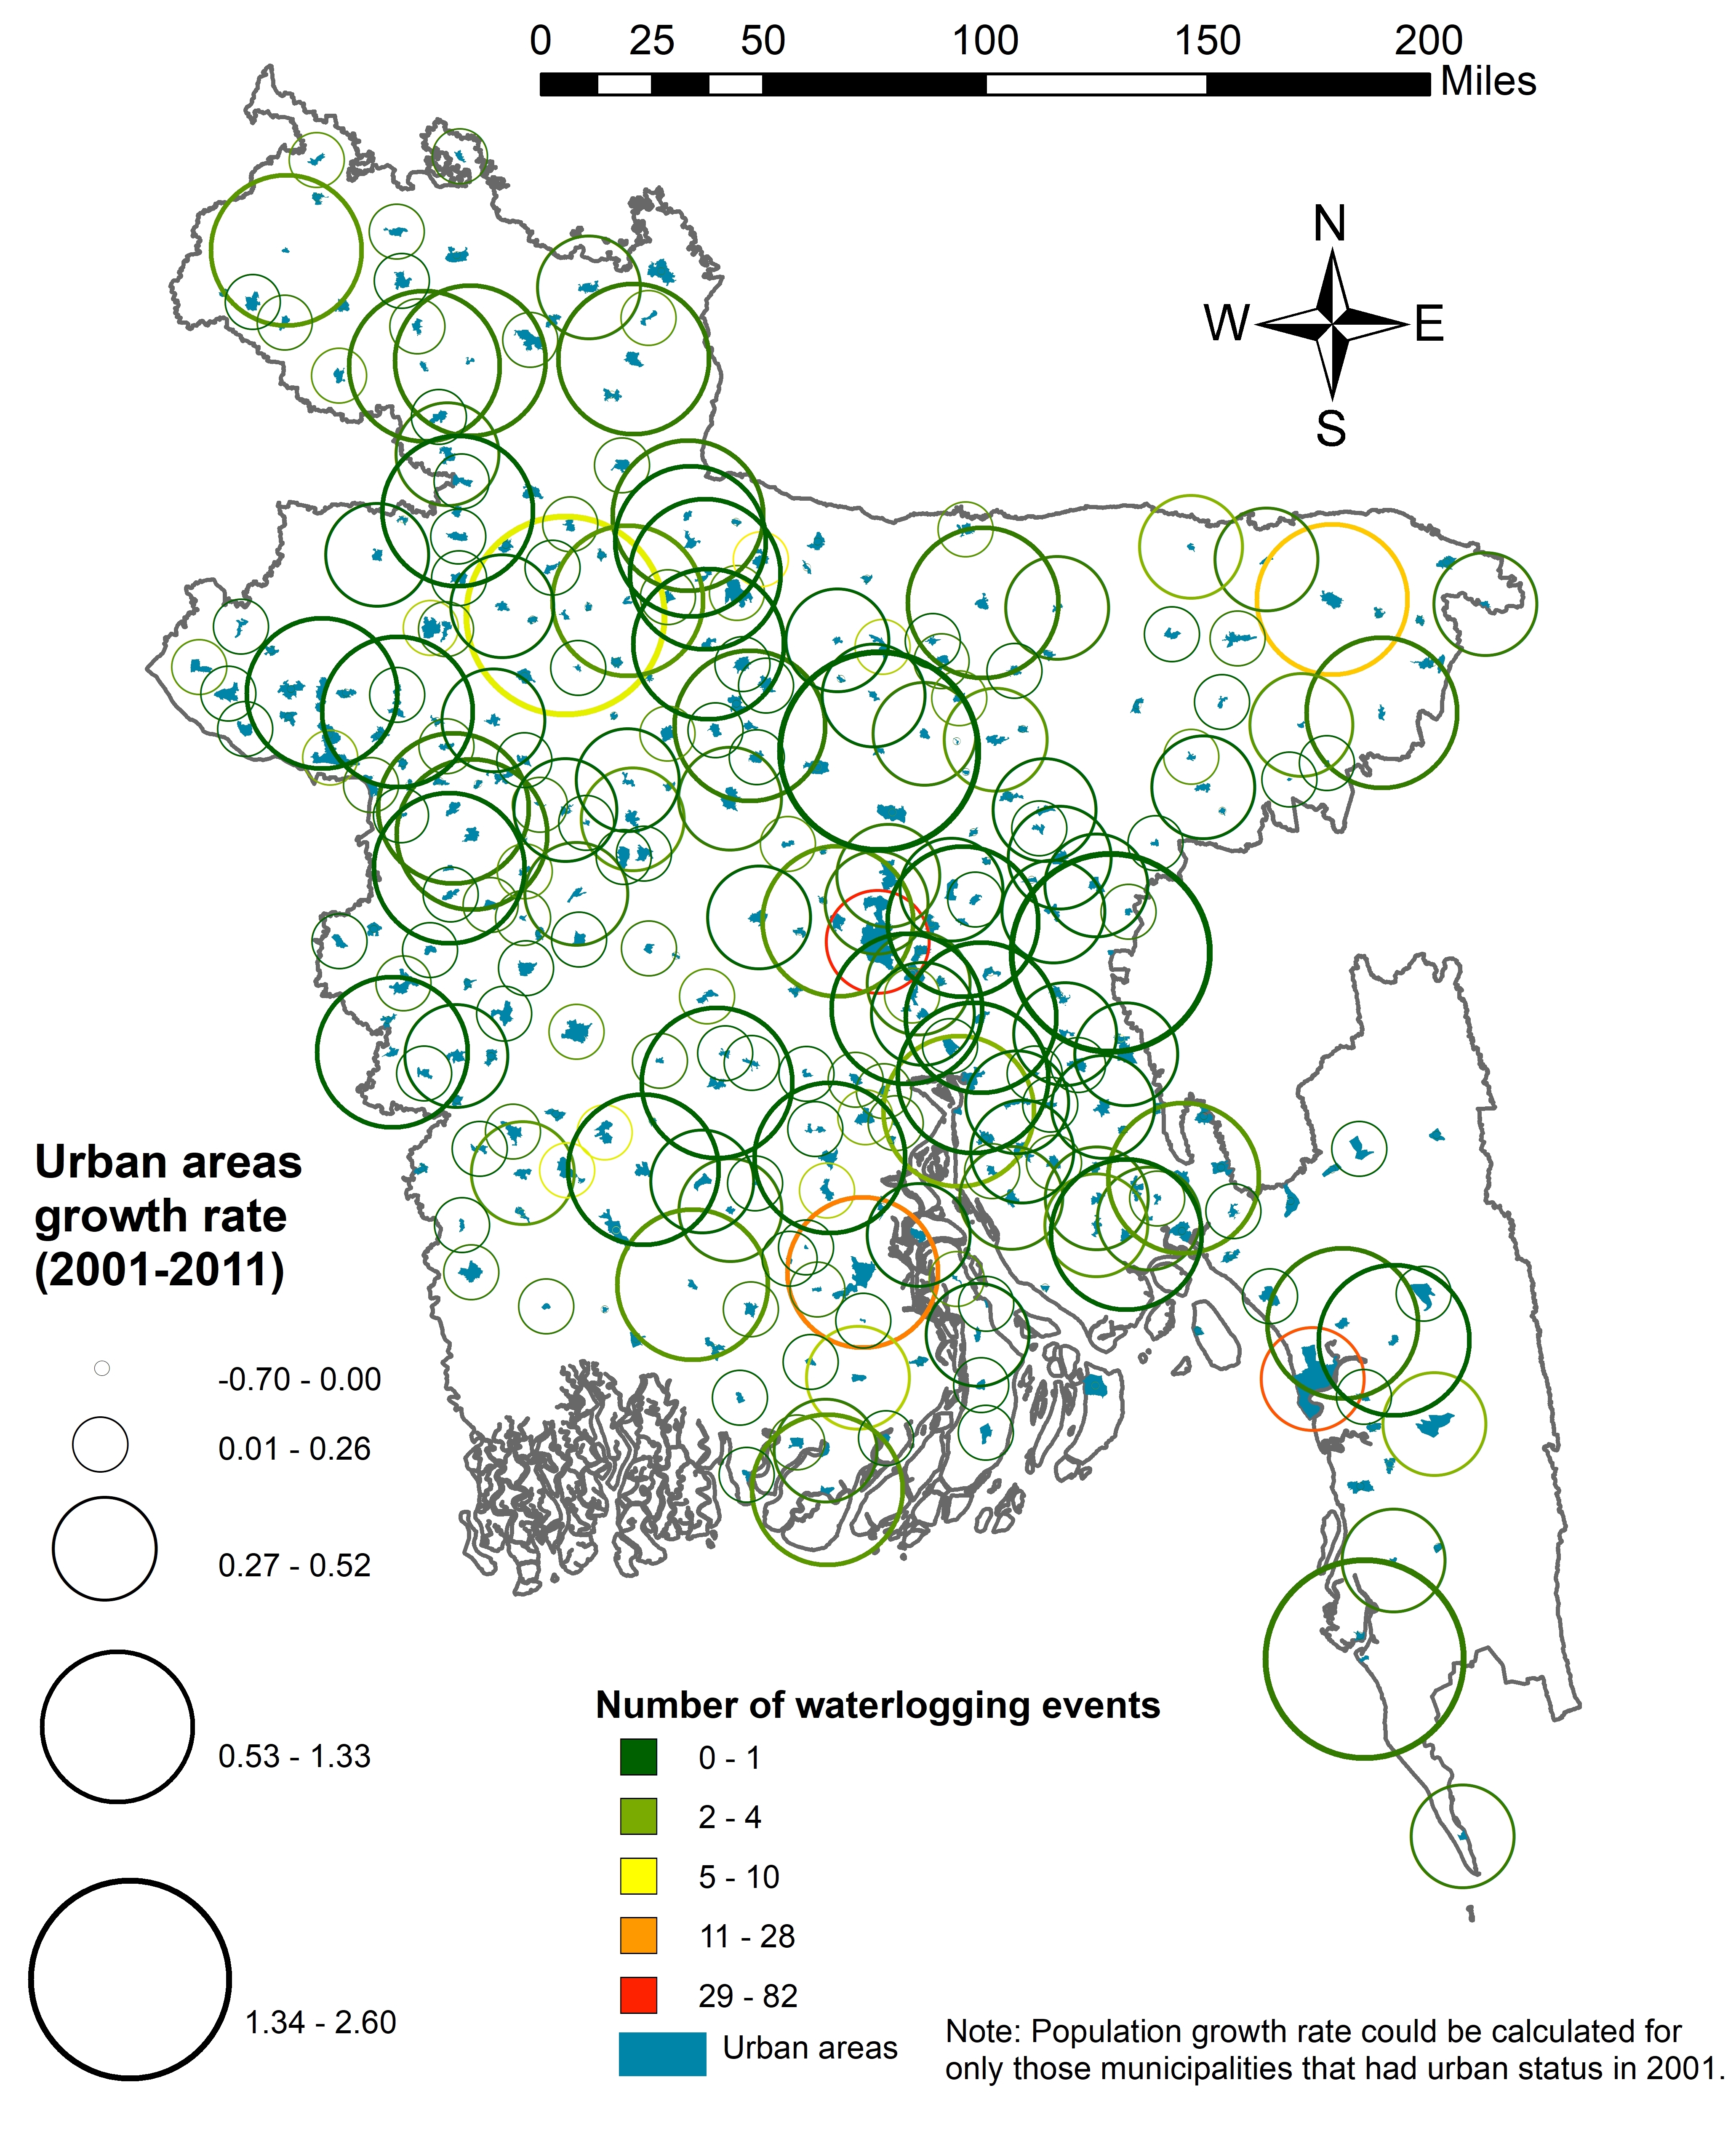
Depicting how urban area growth rate (circle size) relates to waterlogging events (circle color) across Bangladesh between 2001 and 2011. Blue-bordered areas represent urban regions
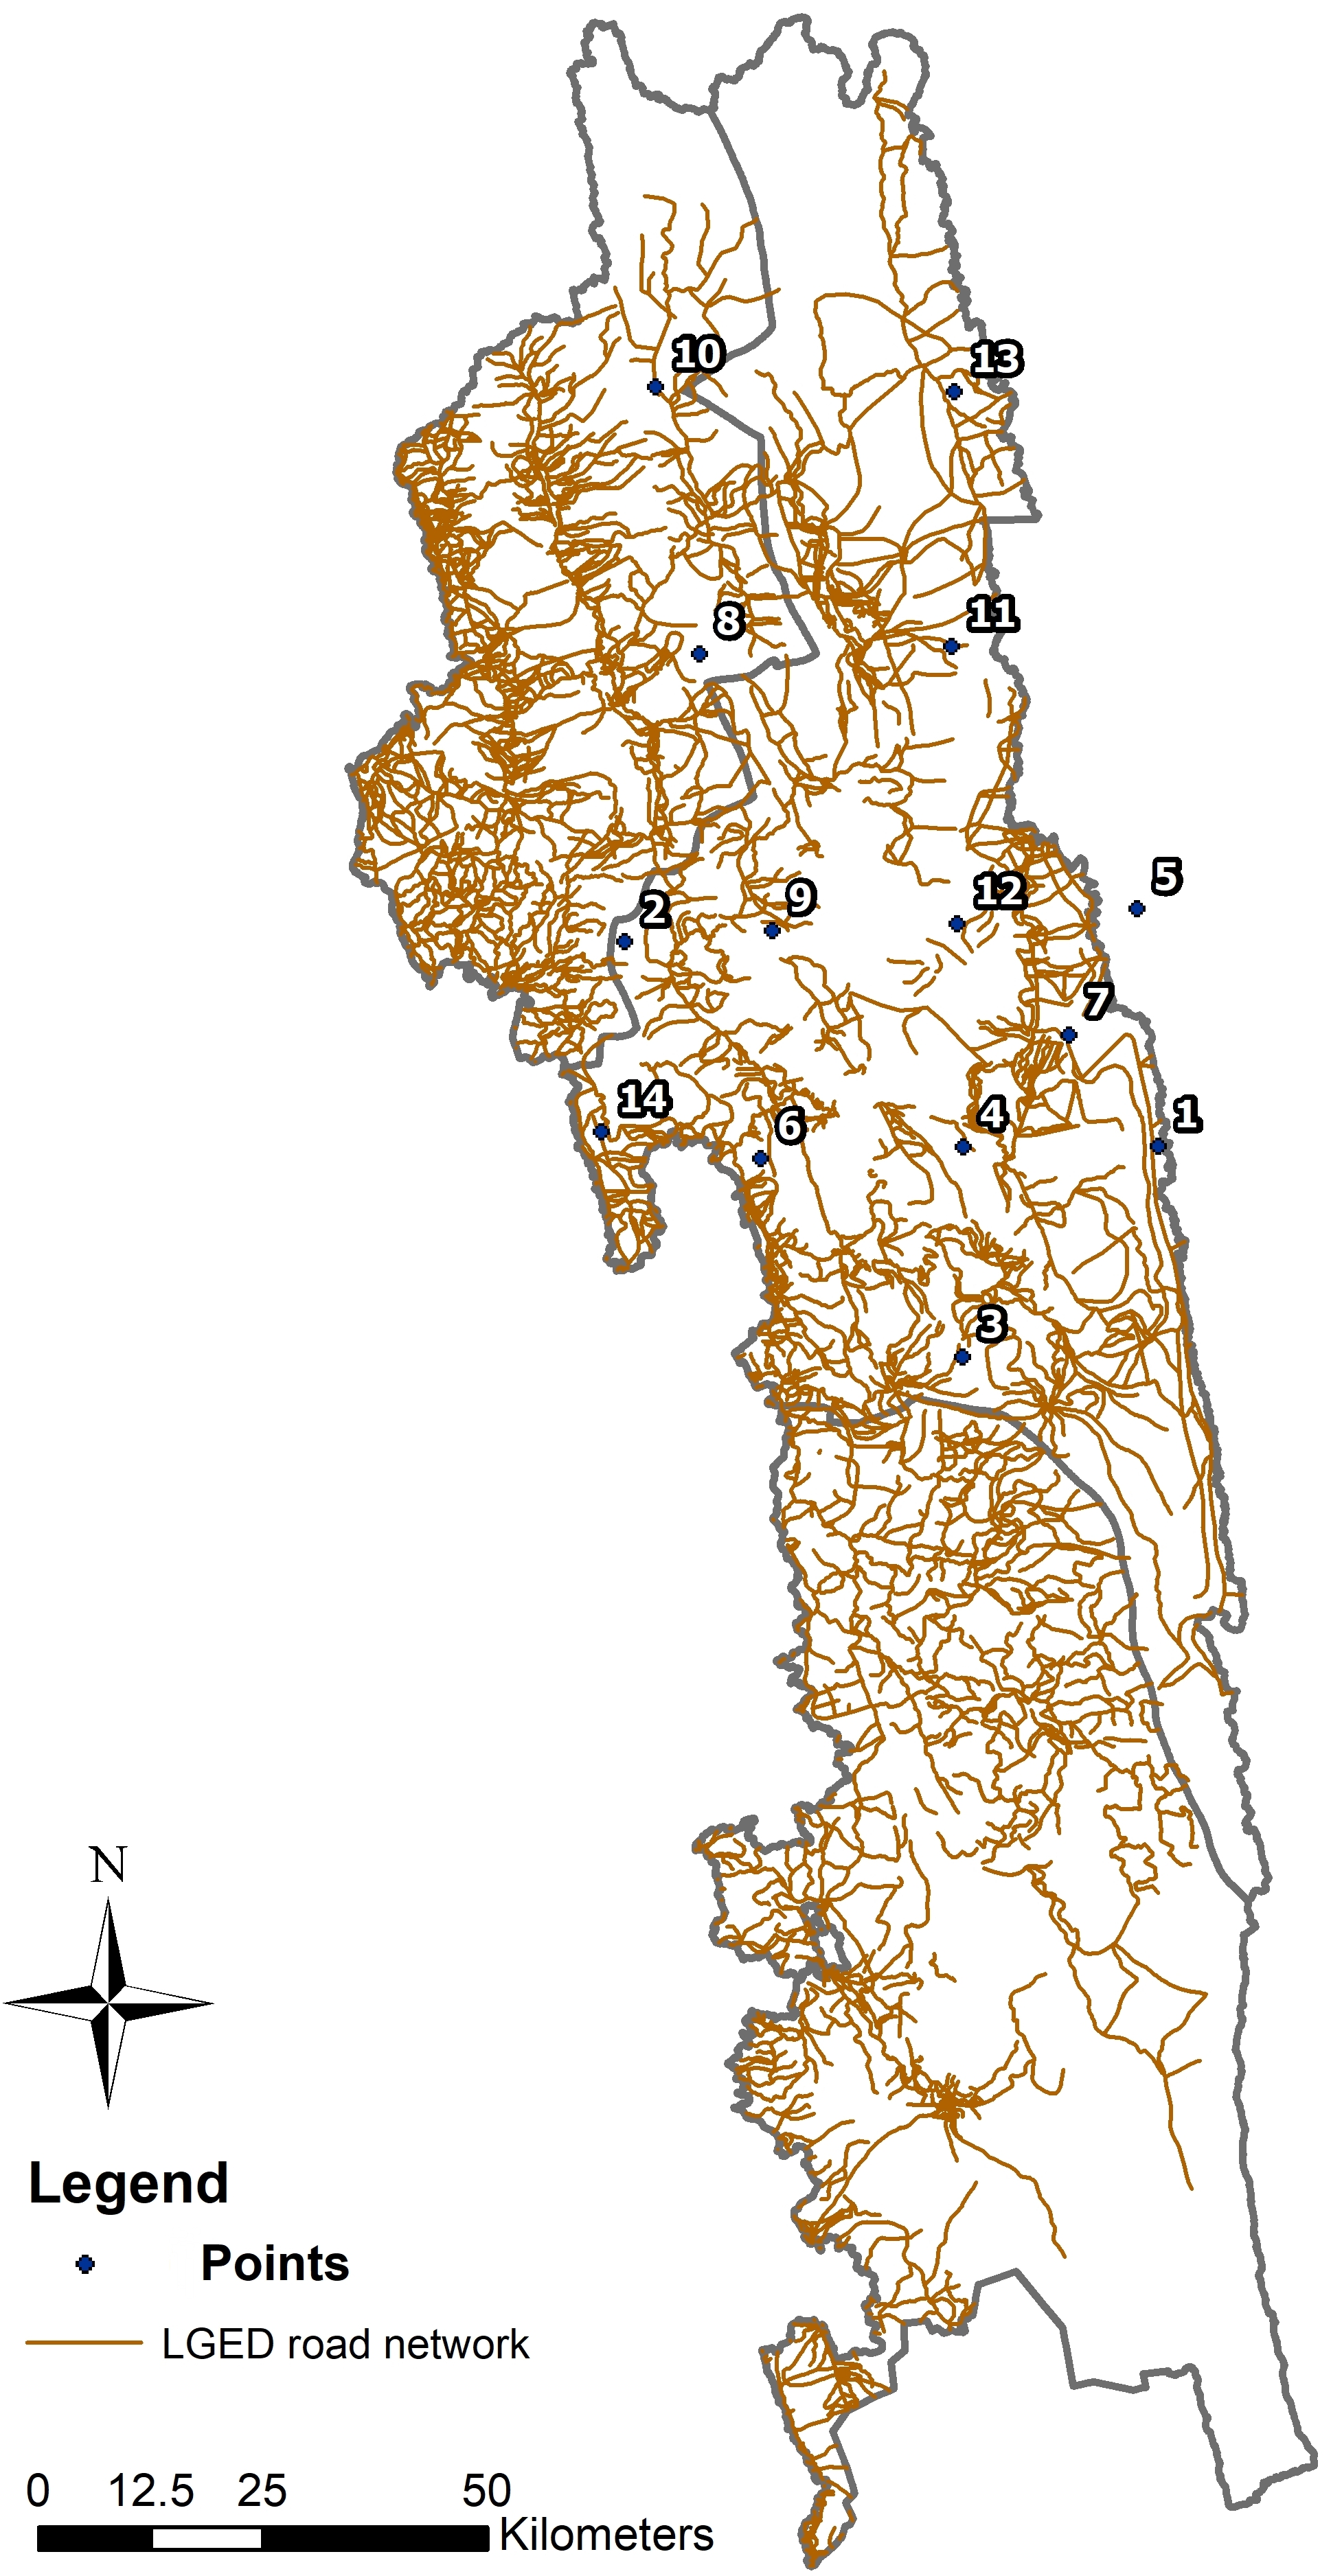
Map showing randomly selected sampling areas for a field survey, with brown lines marking roads connecting the points
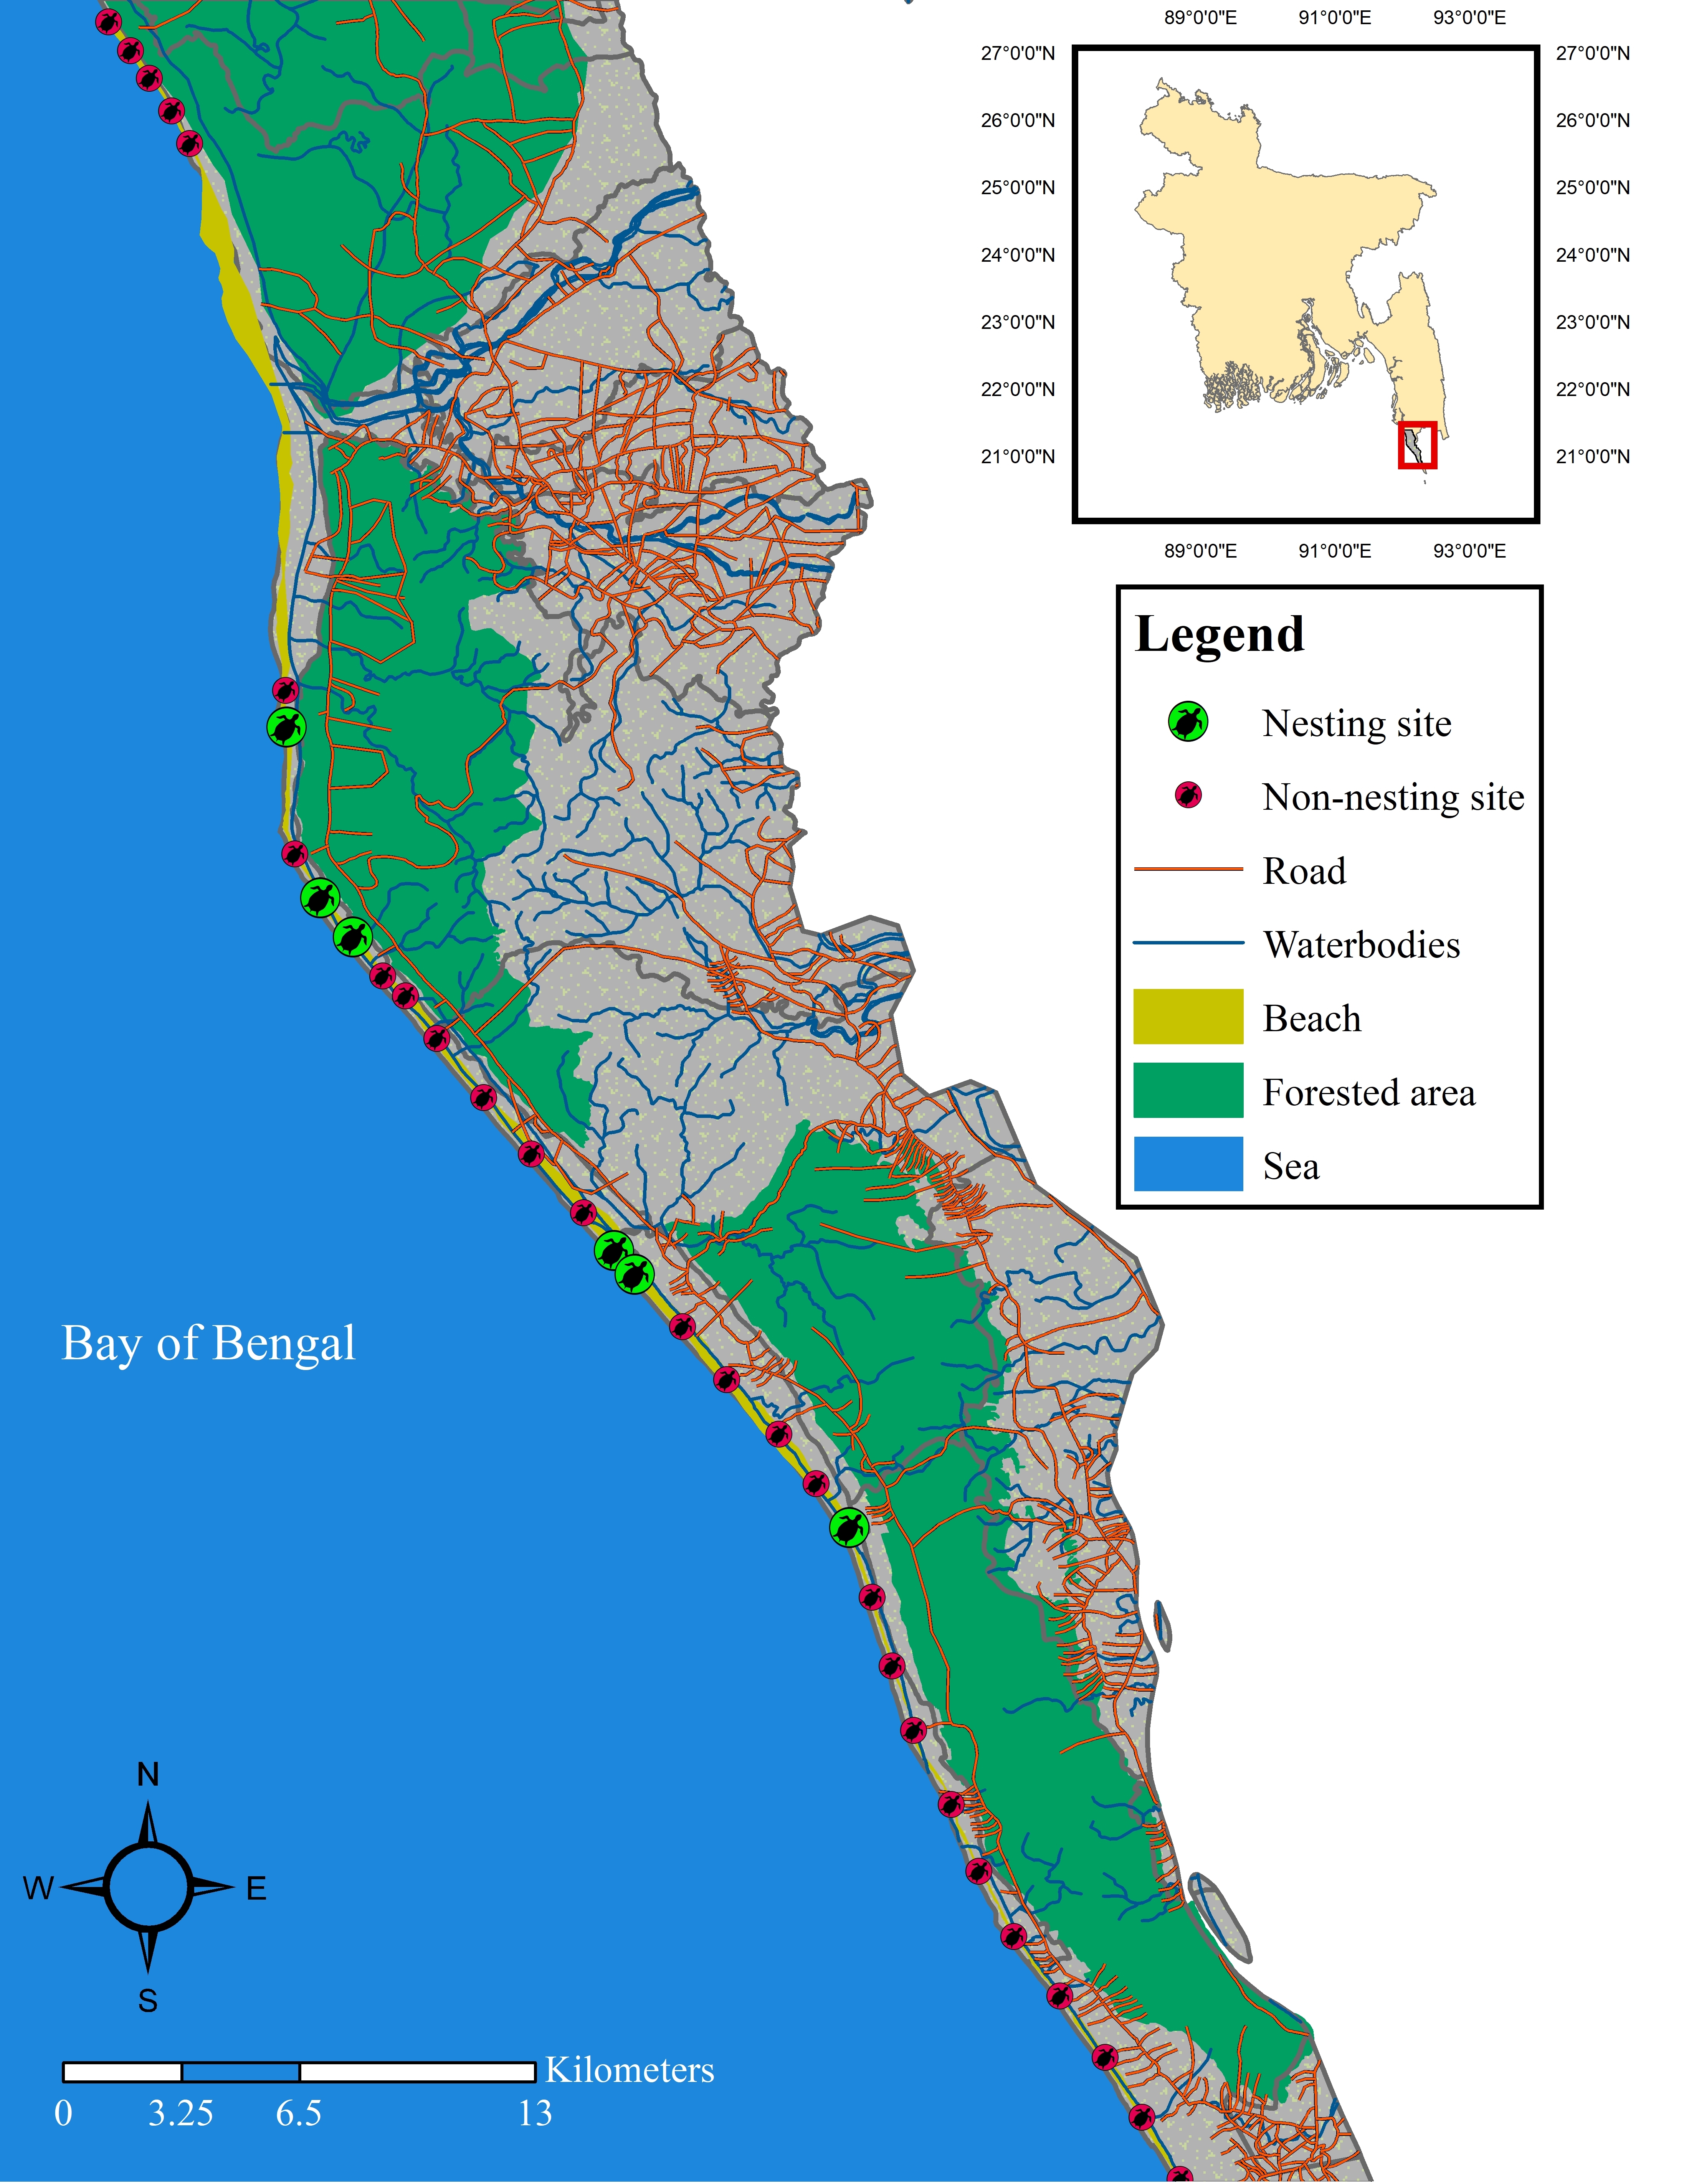
Study Area Map of sea turtle conservation
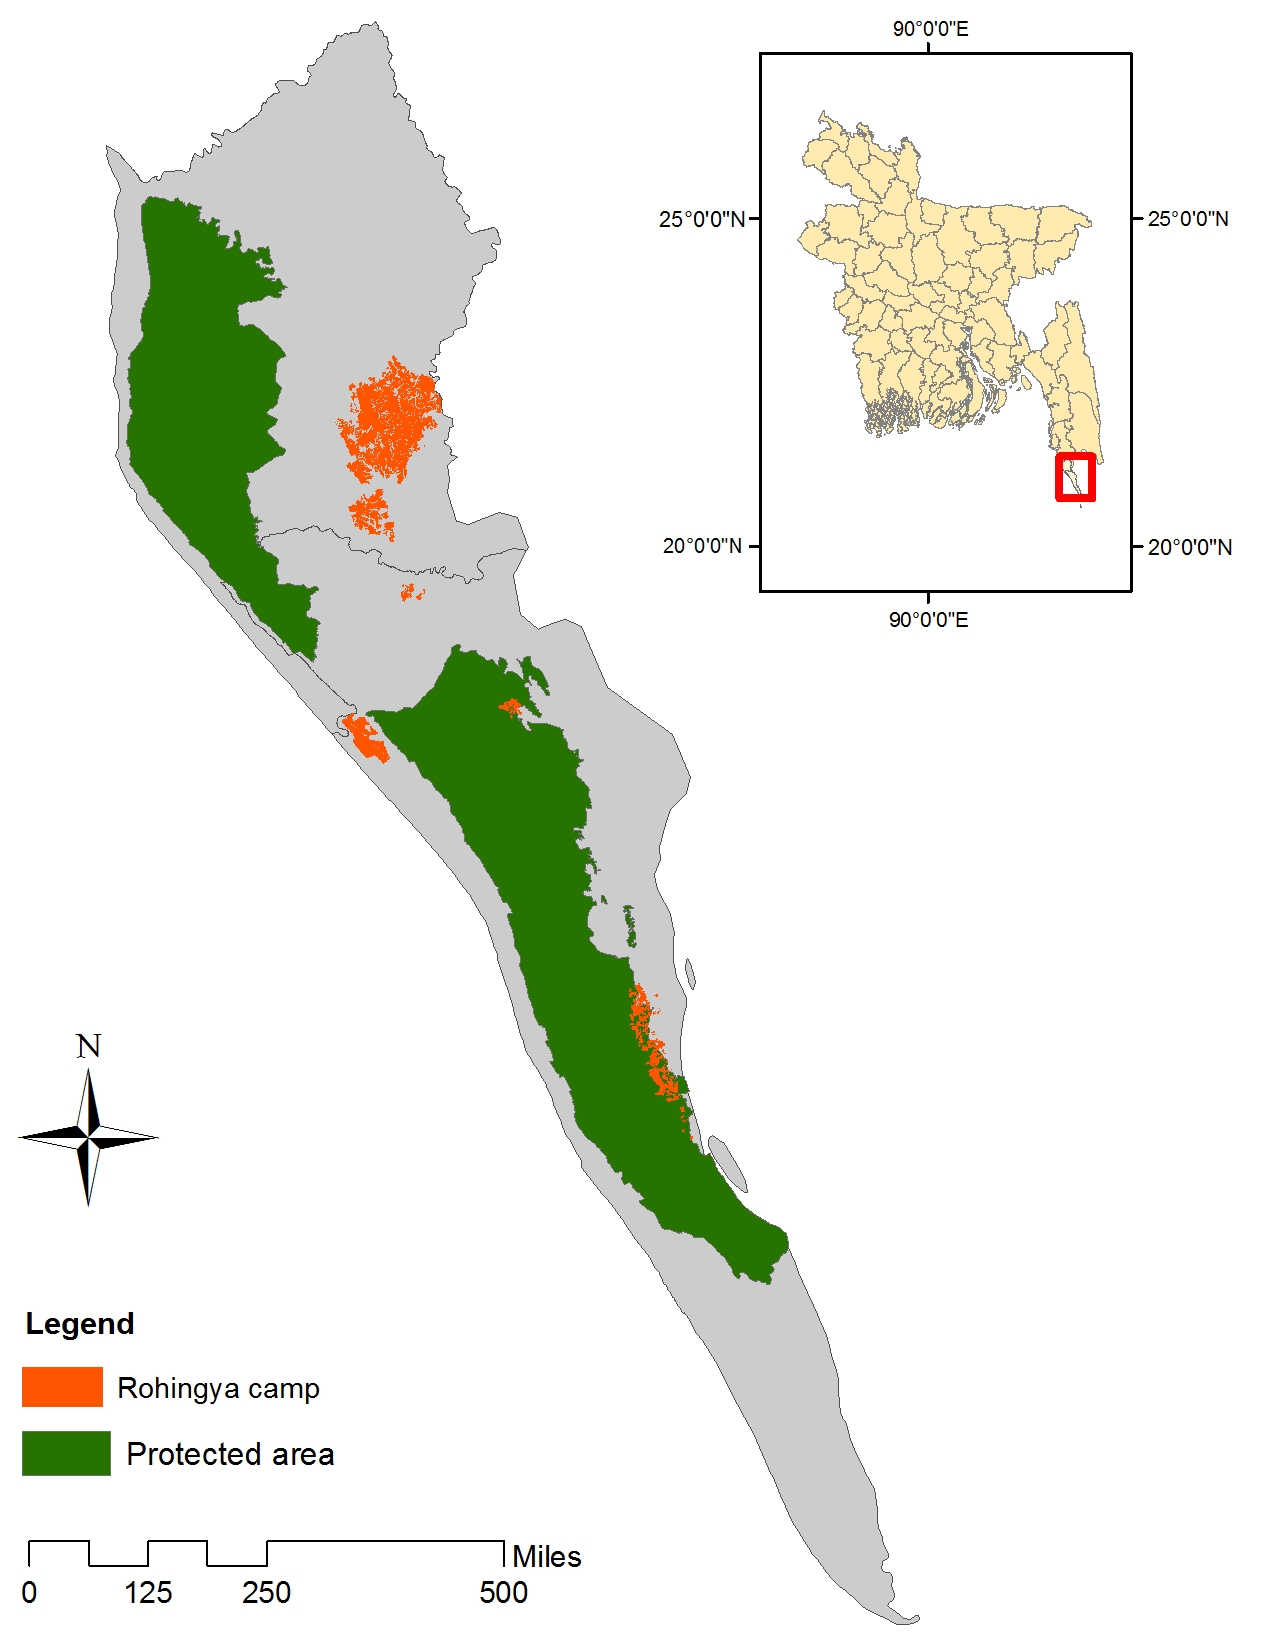
Rohingya Refugee Camp Spots 7
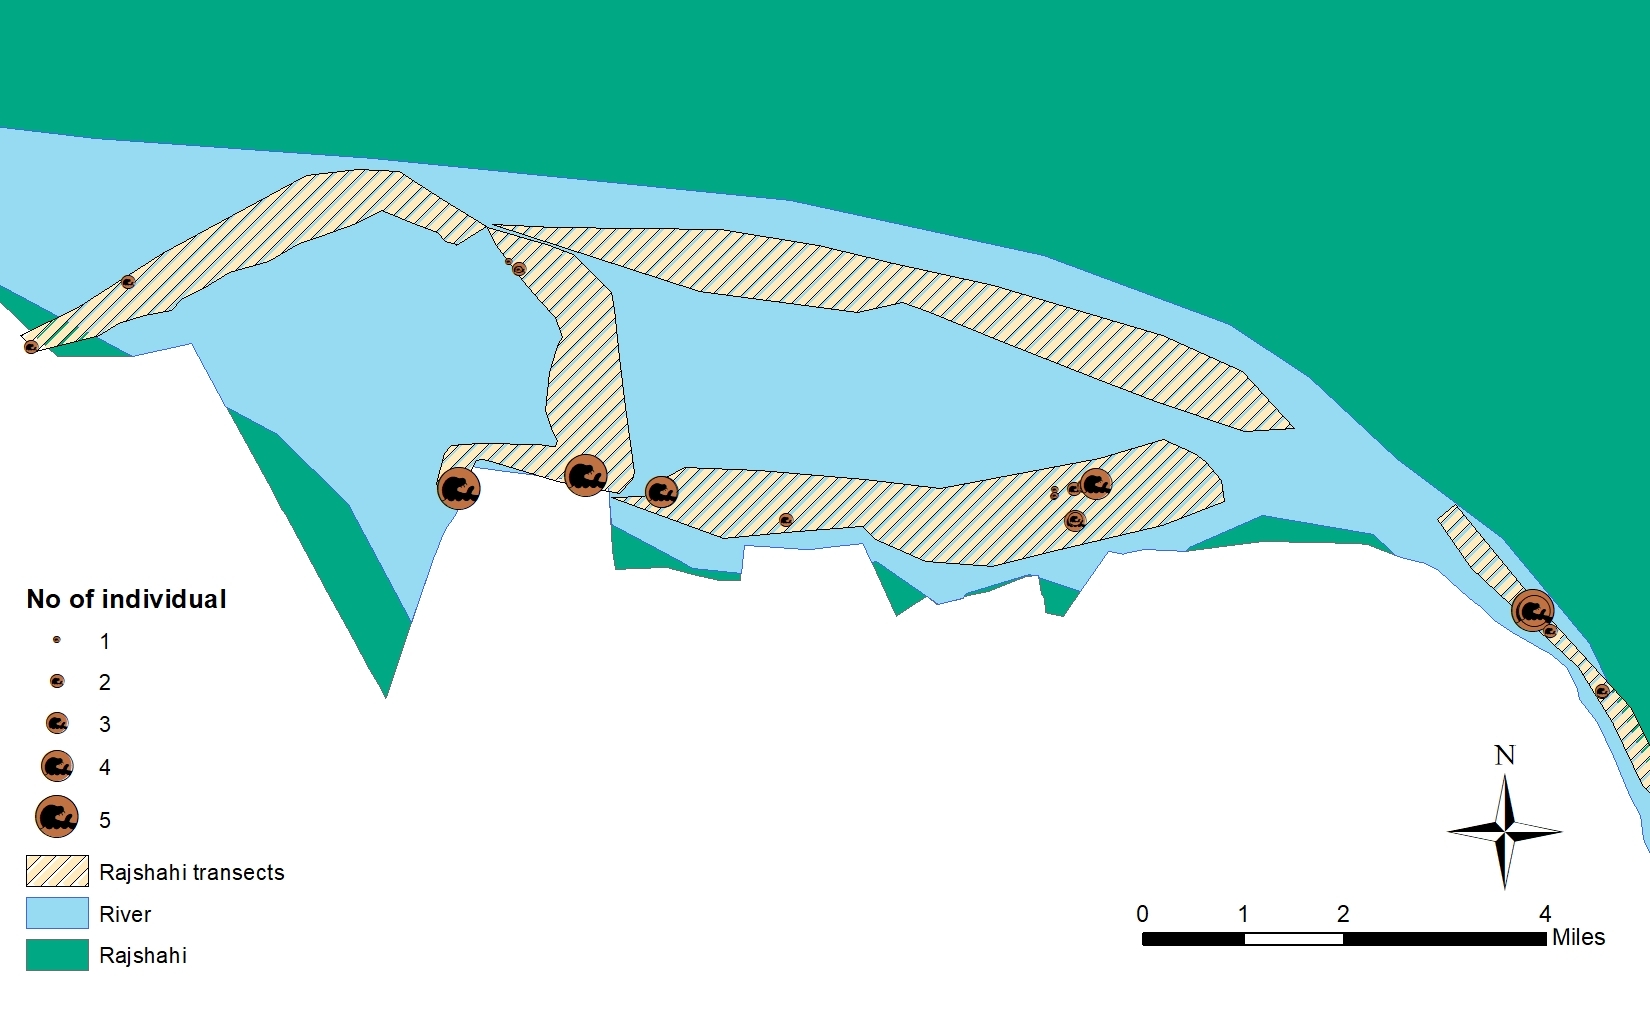
Where signs of Smooth Coated Otters were found in Rajshahi. A total of 62 signs were recorded across five survey areas (marked as transects), mostly along riverbanks and nearby land.
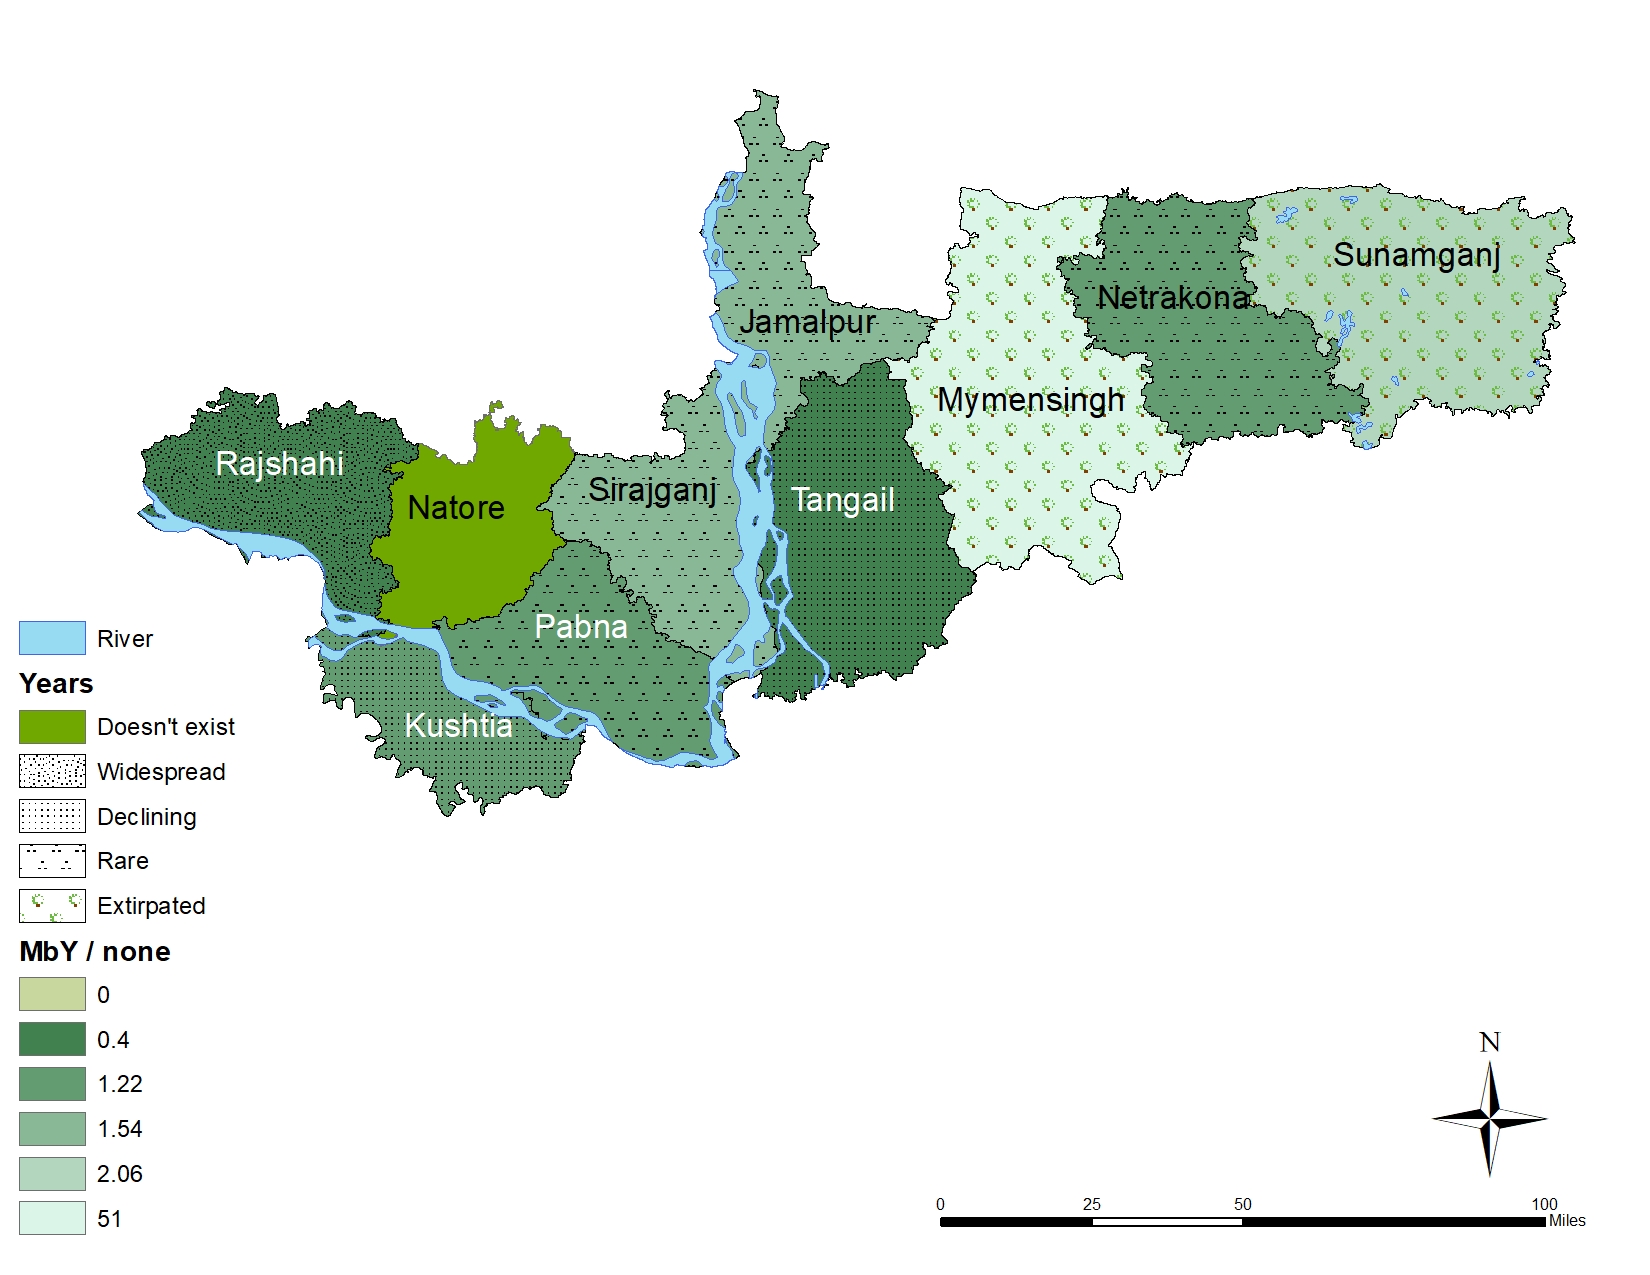
Presence of Otters across the Northern Disctricts of Banglades
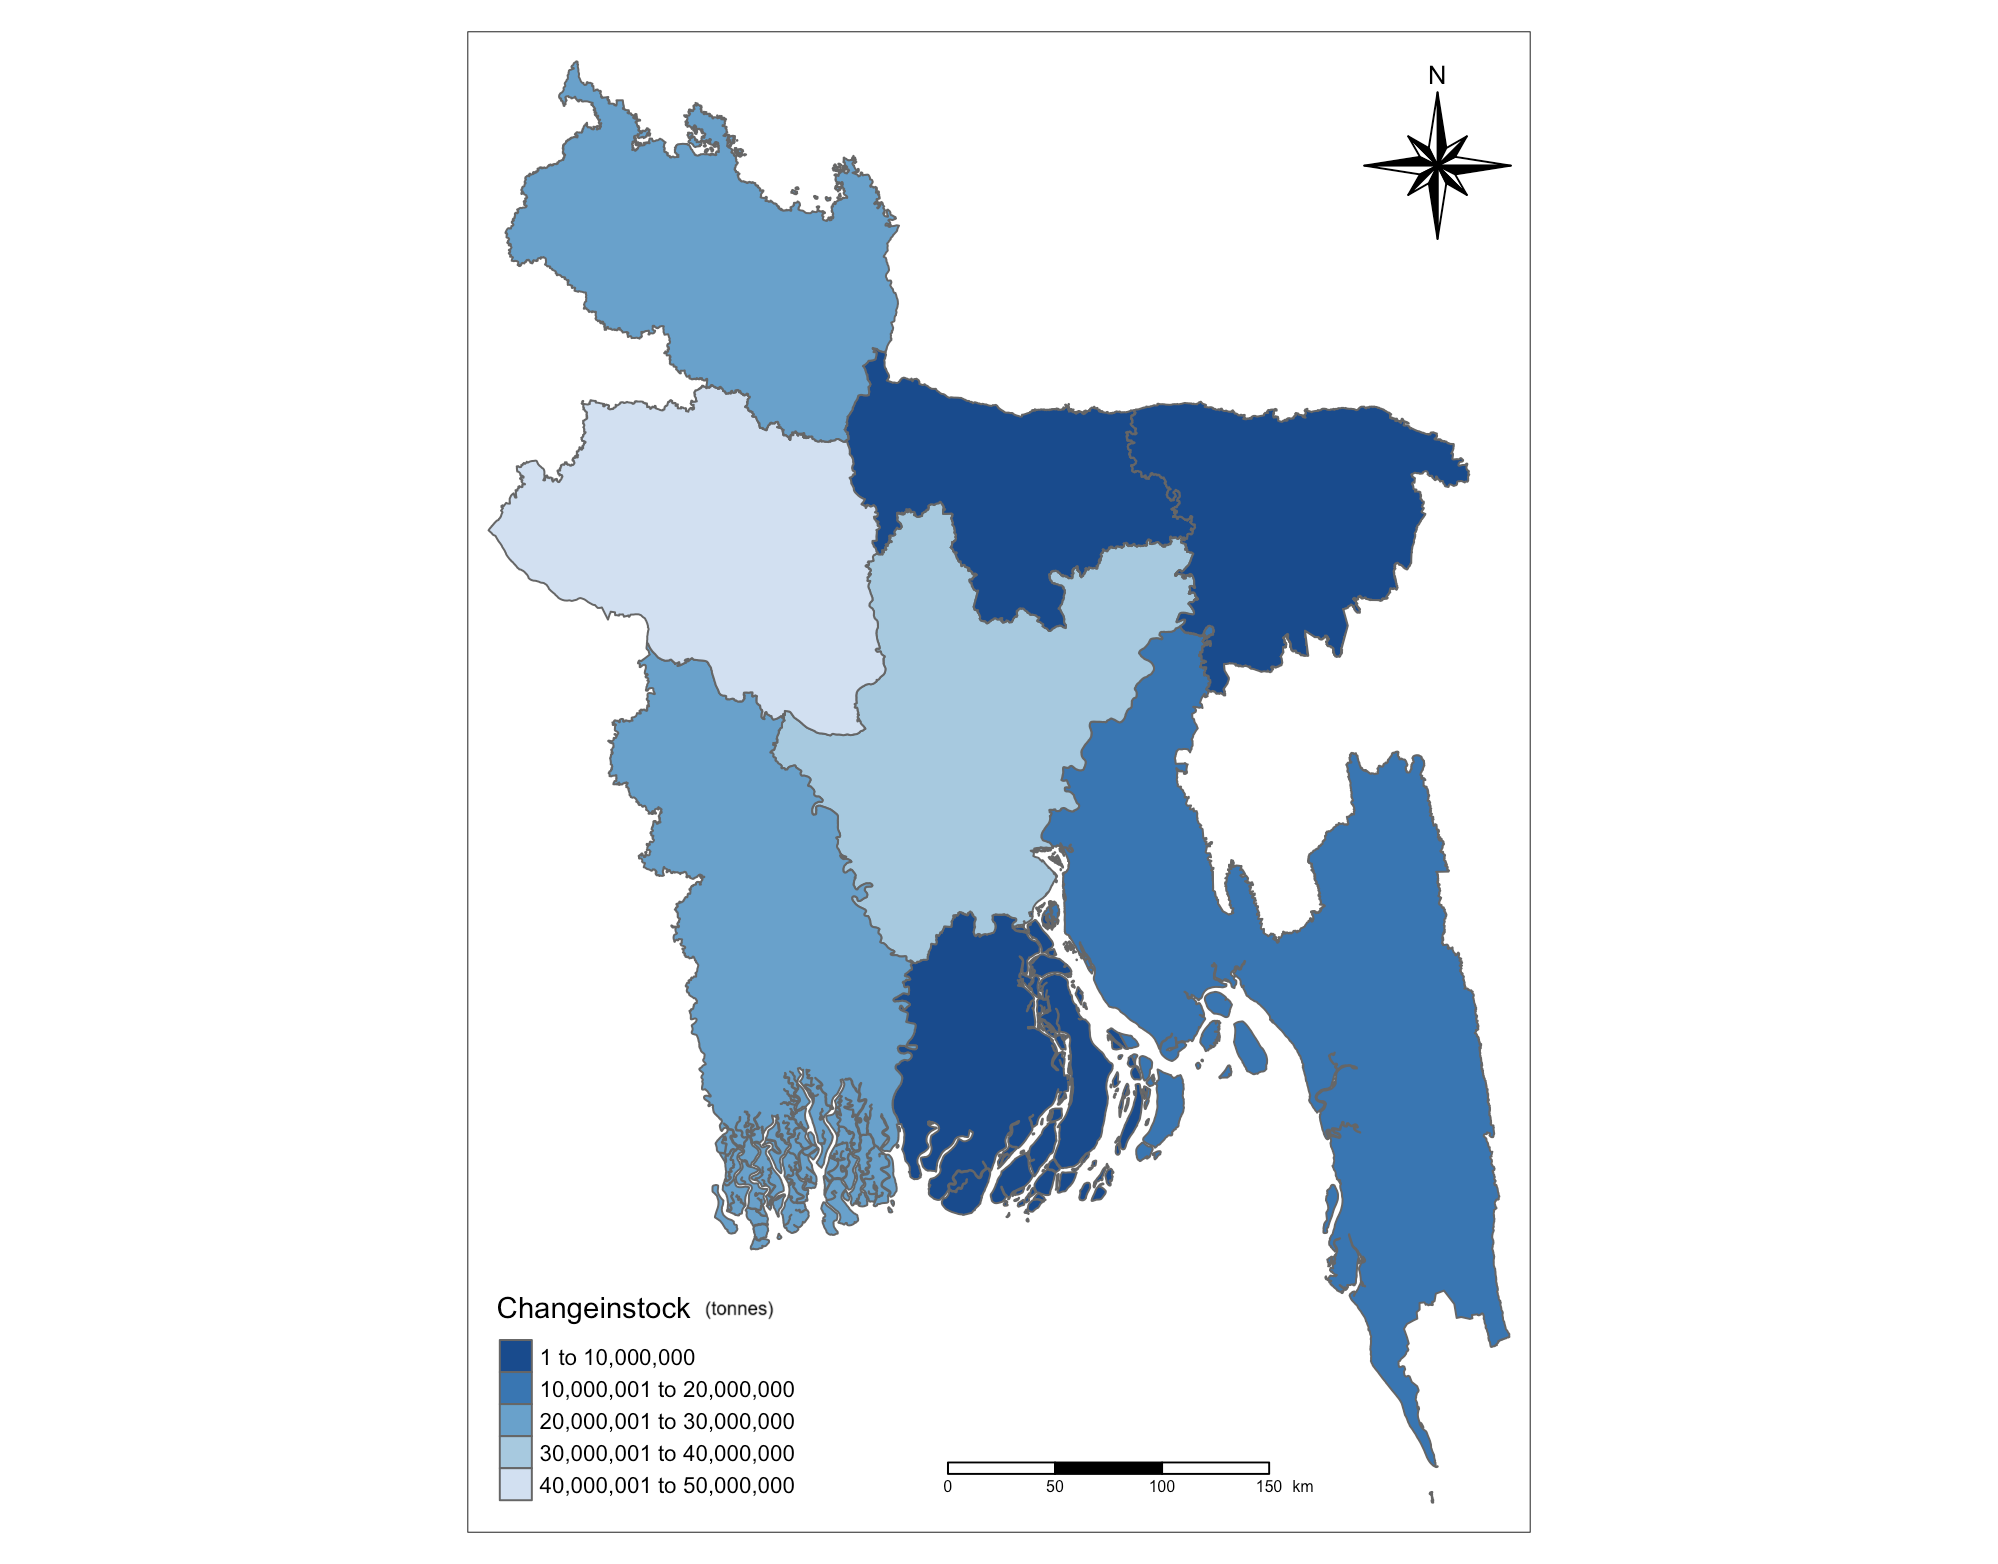
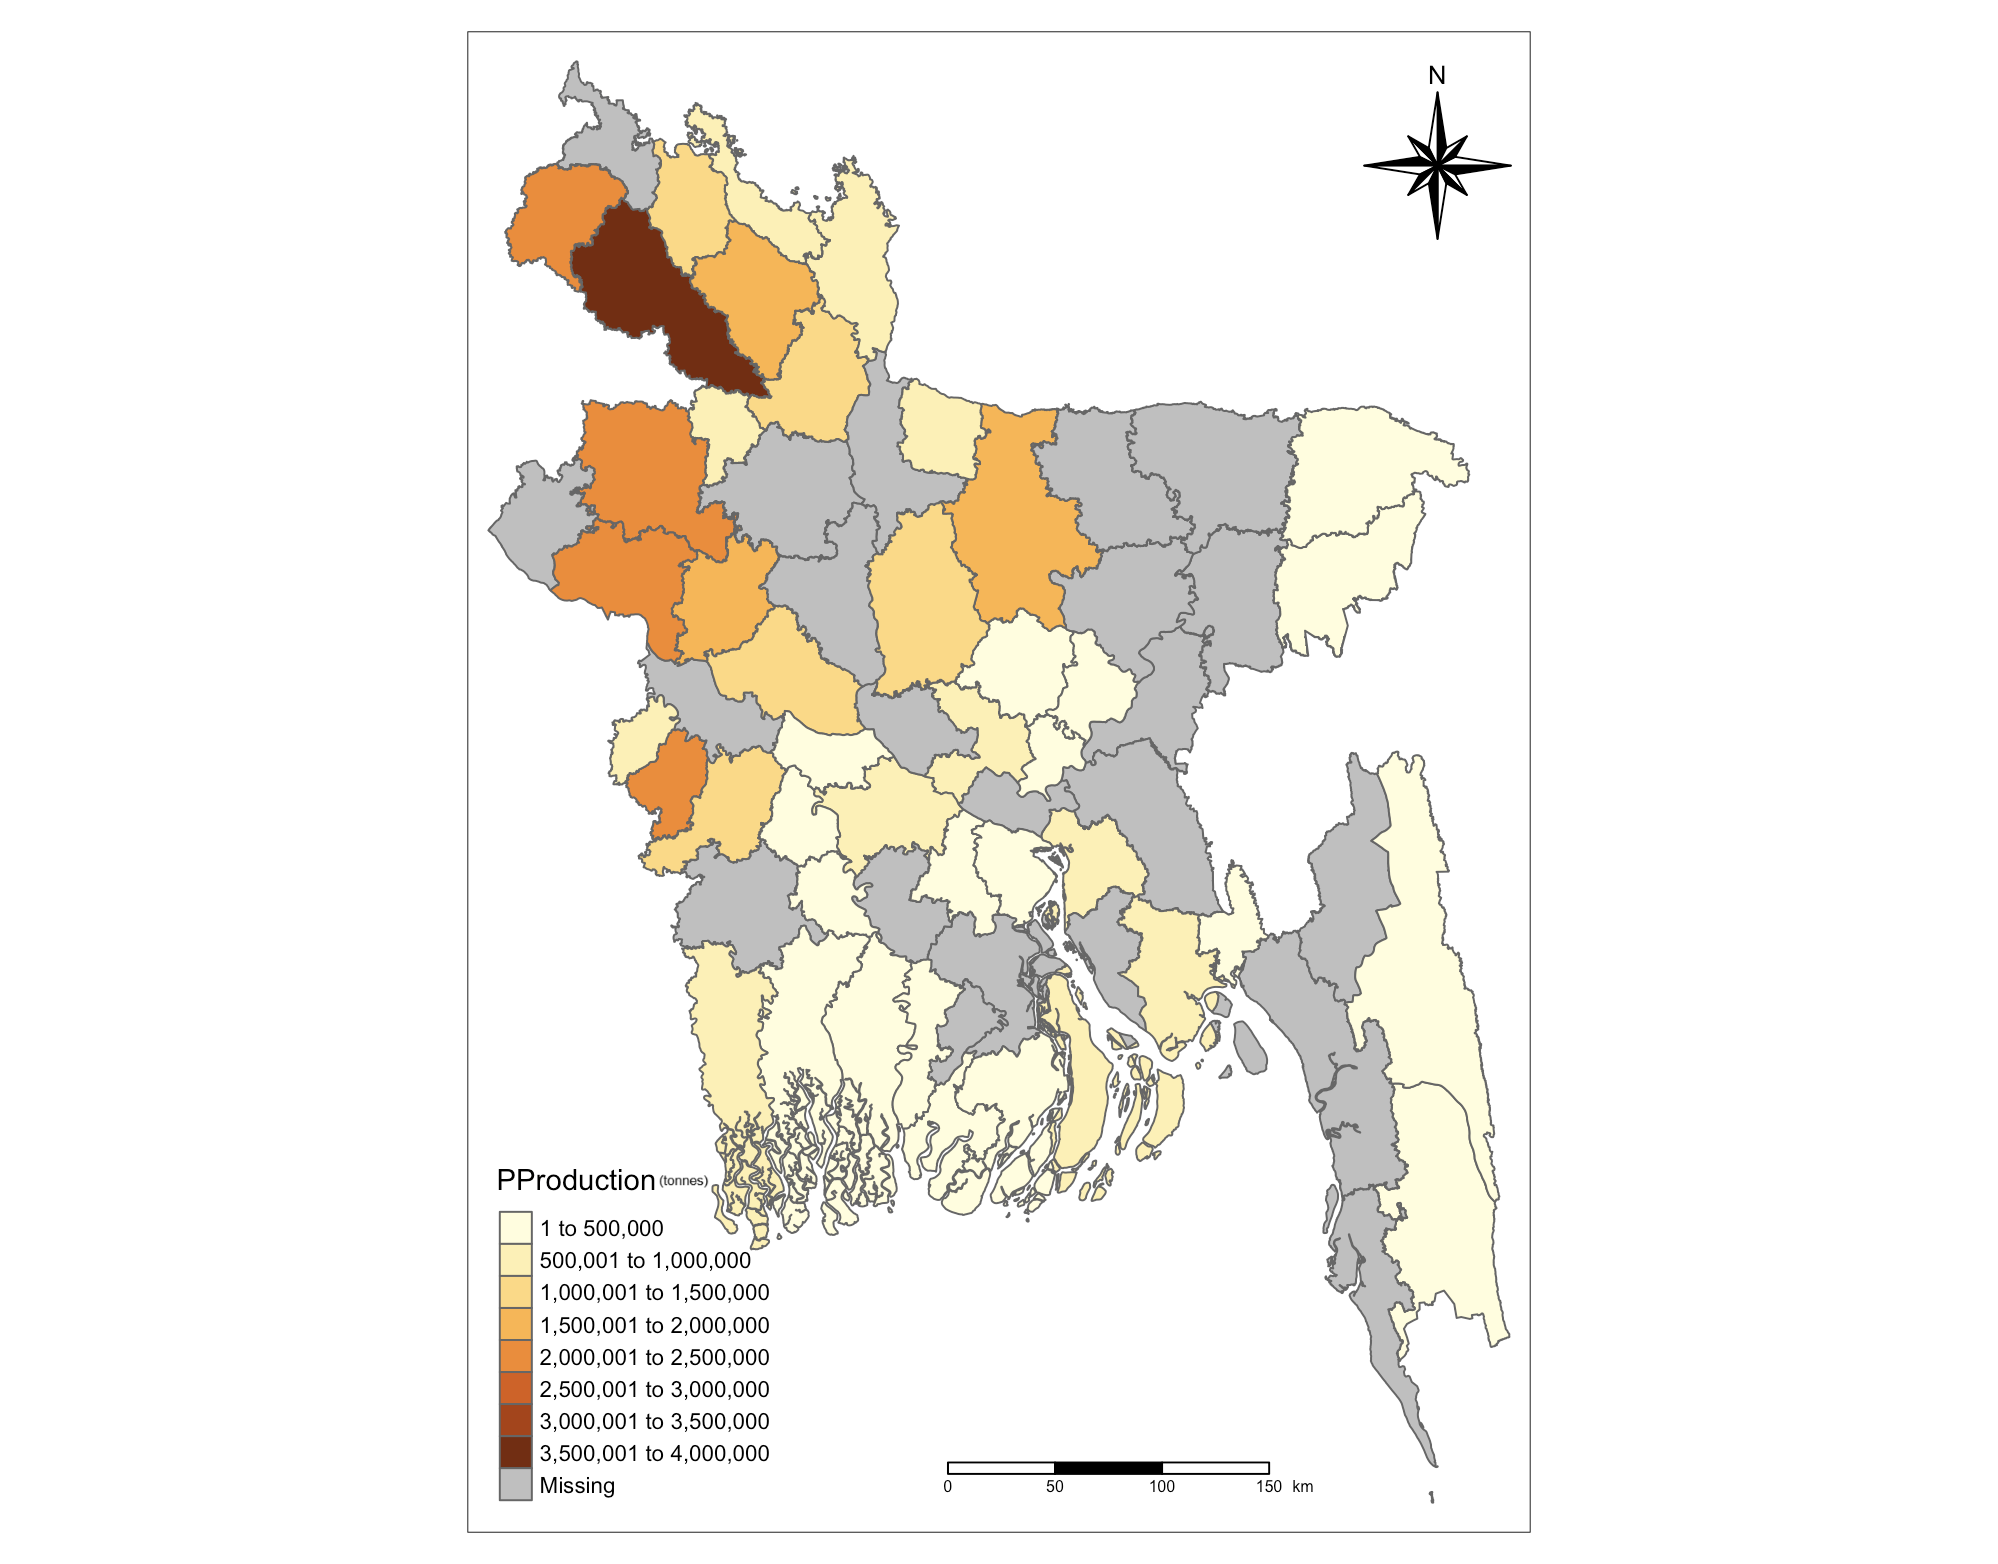
Phosphorus production levels in different districts of Bangladesh
Changes in Phosphorus Production across Bangladesh’s divisions